Index Trend Analysis Report
Prepared for you on Monday, May 6, 2024.
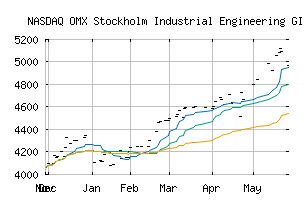
OMX Stockholm Industrial Engineering GI (NASDAQ:SX502040GI)
Countertrend Up (+85) - SX502040GI is showing short-term weakness. However, look for the longer-term bullish trend to resume. As always, continue to monitor the trend score and utilize a stop order.
Is it time to buy, sell, or avoid SX502040GI?
MarketClub looks at technical strength and momentum to determine if the timing is right for SX502040GI.
Learn more about the Trade Triangles and how we make technical analysis as easy as buy and sell.
|
|||||||||||||||
|
|||||||||||||||
MarketClub’s Trade Triangles for SX502040GI
![]() The long-term trend has been UP since Nov 17th, 2023 at 3975.36
The long-term trend has been UP since Nov 17th, 2023 at 3975.36
![]() The intermediate-term trend has been UP since Apr 24th, 2024 at 4707.39
The intermediate-term trend has been UP since Apr 24th, 2024 at 4707.39
![]() The short-term trend has been UP since Apr 24th, 2024 at 4637.53
The short-term trend has been UP since Apr 24th, 2024 at 4637.53
Smart Scan Analysis for SX502040GI
Based on our trend formula, SX502040GI is rated as a +80 on a scale from -100 (Strong Downtrend) to +100 (Strong Uptrend).
| Open | High | Low | Price | Change |
|---|---|---|---|---|
| 4796.01 | 4796.01 | 4796.01 | 4796.01 | +62.49 |
| Prev. Close | Volume | Bid | Ask | Time |
| 4796.01 | 0 | 2024-05-03 11:35:00 |