Index Trend Analysis Report
Prepared for you on Sunday, May 5, 2024.
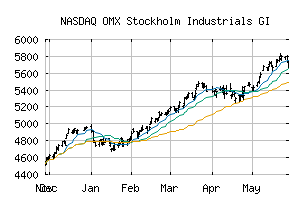
OMX Stockholm Industrials GI (NASDAQ:SX50GI)
Countertrend Up (+85) - SX50GI is showing short-term weakness. However, look for the longer-term bullish trend to resume. As always, continue to monitor the trend score and utilize a stop order.
Is it time to buy, sell, or avoid SX50GI?
MarketClub looks at technical strength and momentum to determine if the timing is right for SX50GI.
Learn more about the Trade Triangles and how we make technical analysis as easy as buy and sell.
|
|||||||||||||||
|
|||||||||||||||
MarketClub’s Trade Triangles for SX50GI
![]() The long-term trend has been UP since Nov 22nd, 2023 at 4560.06
The long-term trend has been UP since Nov 22nd, 2023 at 4560.06
![]() The intermediate-term trend has been UP since Apr 29th, 2024 at 5474.83
The intermediate-term trend has been UP since Apr 29th, 2024 at 5474.83
![]() The short-term trend has been DOWN since May 3rd, 2024 at 5389.28
The short-term trend has been DOWN since May 3rd, 2024 at 5389.28
Smart Scan Analysis for SX50GI
Based on our trend formula, SX50GI is rated as a +85 on a scale from -100 (Strong Downtrend) to +100 (Strong Uptrend).
| Open | High | Low | Price | Change |
|---|---|---|---|---|
| 5409.95 | 5450.65 | 5384.98 | 5436.99 | +39.71 |
| Prev. Close | Volume | Bid | Ask | Time |
| 5436.99 | 0 | 2024-05-03 11:32:00 |