Index Trend Analysis Report
Prepared for you on Tuesday, February 4, 2025.
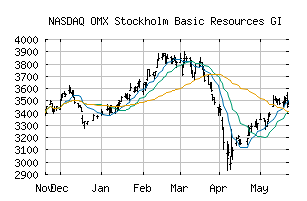
OMX Stockholm Basic Resources GI (NASDAQ:SX5510GI)
Countertrend Up (+85) - SX5510GI is showing short-term weakness. However, look for the longer-term bullish trend to resume. As always, continue to monitor the trend score and utilize a stop order.
Is it time to buy, sell, or avoid SX5510GI?
MarketClub looks at technical strength and momentum to determine if the timing is right for SX5510GI.
Learn more about the Trade Triangles and how we make technical analysis as easy as buy and sell.
|
|||||||||||||||
|
|||||||||||||||
MarketClub’s Trade Triangles for SX5510GI
![]() The long-term trend has been UP since Jan 24th, 2025 at 3627.76
The long-term trend has been UP since Jan 24th, 2025 at 3627.76
![]() The intermediate-term trend has been UP since Jan 15th, 2025 at 3472.27
The intermediate-term trend has been UP since Jan 15th, 2025 at 3472.27
![]() The short-term trend has been DOWN since Feb 3rd, 2025 at 3572.57
The short-term trend has been DOWN since Feb 3rd, 2025 at 3572.57
Smart Scan Analysis for SX5510GI
Based on our trend formula, SX5510GI is rated as a +85 on a scale from -100 (Strong Downtrend) to +100 (Strong Uptrend).
| Open | High | Low | Price | Change |
|---|---|---|---|---|
| 3650.91 | 3650.91 | 3585.86 | 3637.08 | +7.00 |
| Prev. Close | Volume | Bid | Ask | Time |
| 3630.08 | 0 | 2025-02-04 11:34:00 |