Index Trend Analysis Report
Prepared for you on Friday, May 9, 2025.
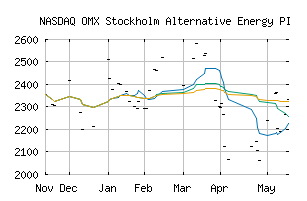
OMX Stockholm Alternative Energy PI (NASDAQ:SX601020PI)
Sidelines Mode (+50) - SX601020PI is failing to move into a strong trend and is encountering choppy trading conditions. Be cautious and consider taking a sidelines position until SX601020PI can gain momentum.
Is it time to buy, sell, or avoid SX601020PI?
MarketClub looks at technical strength and momentum to determine if the timing is right for SX601020PI.
Learn more about the Trade Triangles and how we make technical analysis as easy as buy and sell.
|
|||||||||||||||
|
|||||||||||||||
MarketClub’s Trade Triangles for SX601020PI
![]() The long-term trend has been DOWN since Apr 3rd, 2025 at 2291.51
The long-term trend has been DOWN since Apr 3rd, 2025 at 2291.51
![]() The intermediate-term trend has been UP since May 6th, 2025 at 2144.92
The intermediate-term trend has been UP since May 6th, 2025 at 2144.92
![]() The short-term trend has been UP since May 6th, 2025 at 2144.92
The short-term trend has been UP since May 6th, 2025 at 2144.92
Smart Scan Analysis for SX601020PI
Based on our trend formula, SX601020PI is rated as a +50 on a scale from -100 (Strong Downtrend) to +100 (Strong Uptrend).
| Open | High | Low | Price | Change |
|---|---|---|---|---|
| 2238.20 | 2238.20 | 2238.20 | 2238.20 | +118.77 |
| Prev. Close | Volume | Bid | Ask | Time |
| 2302.94 | 0 | 2025-05-06 11:35:00 |