Stock Trend Analysis Report
Prepared for you on Saturday, May 10, 2025.
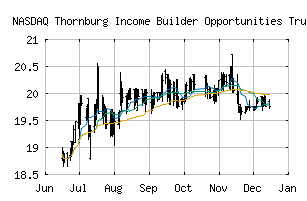
Thornburg Income Builder Opportunities Trust - Closed End Fund (NASDAQ:TBLD)
Countertrend Up (+85) - TBLD is showing short-term weakness. However, look for the longer-term bullish trend to resume. As always, continue to monitor the trend score and utilize a stop order.
Is it time to buy, sell, or avoid TBLD?
MarketClub looks at technical strength and momentum to determine if the timing is right for TBLD.
Learn more about the Trade Triangles and how we make technical analysis as easy as buy and sell.
|
|||||||||||||||
|
|||||||||||||||
MarketClub’s Trade Triangles for TBLD
![]() The long-term trend has been UP since Apr 30th, 2025 at 18.0300
The long-term trend has been UP since Apr 30th, 2025 at 18.0300
![]() The intermediate-term trend has been UP since Apr 29th, 2025 at 17.9900
The intermediate-term trend has been UP since Apr 29th, 2025 at 17.9900
![]() The short-term trend has been DOWN since May 9th, 2025 at 18.0235
The short-term trend has been DOWN since May 9th, 2025 at 18.0235
Smart Scan Analysis for TBLD
Based on our trend formula, TBLD is rated as a +85 on a scale from -100 (Strong Downtrend) to +100 (Strong Uptrend).
| Open | High | Low | Price | Change |
|---|---|---|---|---|
| 18.31 | 18.31 | 18.01 | 18.14 | -0.05 |
| Prev. Close | Volume | Bid | Ask | Time |
| 18.17 | 50184 | 2025-05-09 15:58:02 |
| 52wk High | 18.64 | 52wk High Date | 2025-05-06 |
| 52wk Low | 15.71 | 52wk Low Date | 2024-05-13 |
| Average Volume | 71,944 | Assets | 625,528,796M |
| Liabilities | 2,583,583M | P/E Ratio | 4.9389 |