Stock Trend Analysis Report
Prepared for you on Friday, May 9, 2025.
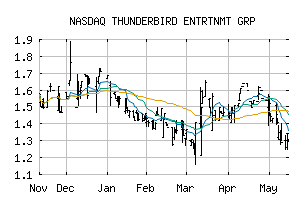
THUNDERBIRD ENTRTNMT GRP (NASDAQ:THBRF)
Long-Term Downtrend (-90) - THBRF is in a strong downtrend that is likely to continue. While THBRF is showing intraday strength, it remains in the confines of a bearish trend. Traders should use caution and set stops.
Is it time to buy, sell, or avoid THBRF?
MarketClub looks at technical strength and momentum to determine if the timing is right for THBRF.
Learn more about the Trade Triangles and how we make technical analysis as easy as buy and sell.
|
|||||||||||||||
|
|||||||||||||||
MarketClub’s Trade Triangles for THBRF
![]() The long-term trend has been DOWN since Mar 27th, 2025 at 1.150
The long-term trend has been DOWN since Mar 27th, 2025 at 1.150
![]() The intermediate-term trend has been DOWN since May 5th, 2025 at 1.115
The intermediate-term trend has been DOWN since May 5th, 2025 at 1.115
![]() The short-term trend has been DOWN since Apr 29th, 2025 at 1.130
The short-term trend has been DOWN since Apr 29th, 2025 at 1.130
Smart Scan Analysis for THBRF
Based on our trend formula, THBRF is rated as a -90 on a scale from -100 (Strong Downtrend) to +100 (Strong Uptrend).
| Open | High | Low | Price | Change |
|---|---|---|---|---|
| 0.950000 | 0.972550 | 0.935132 | 0.958500 | -0.011500 |
| Prev. Close | Volume | Bid | Ask | Time |
| 0.958500 | 18110 | 2025-05-08 15:49:00 |