Mutual Trend Analysis Report
Prepared for you on Thursday, March 19, 2026.
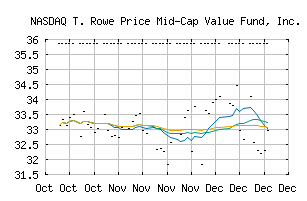
T. Rowe Price Mid-Cap Value Fund, Inc. (NASDAQ:TRMCX)
Weak Uptrend (+65) - TRMCX is showing signs of weakening momentum to the upside. Monitor TRMCX as it may be in the beginning stages of a reversal.
Is it time to buy, sell, or avoid TRMCX?
MarketClub looks at technical strength and momentum to determine if the timing is right for TRMCX.
Learn more about the Trade Triangles and how we make technical analysis as easy as buy and sell.
|
|||||||||||||||
|
|||||||||||||||
MarketClub’s Trade Triangles for TRMCX
![]() The long-term trend has been UP since Dec 1st, 2023 at 31.48
The long-term trend has been UP since Dec 1st, 2023 at 31.48
![]() The intermediate-term trend has been UP since Aug 23rd, 2024 at 35.59
The intermediate-term trend has been UP since Aug 23rd, 2024 at 35.59
![]() The short-term trend has been DOWN since Oct 20th, 2025 at 35.89
The short-term trend has been DOWN since Oct 20th, 2025 at 35.89
Smart Scan Analysis for TRMCX
Based on our trend formula, TRMCX is rated as a +65 on a scale from -100 (Strong Downtrend) to +100 (Strong Uptrend).
| Open | High | Low | Price | Change |
|---|---|---|---|---|
| 35.87 | 35.87 | 35.87 | 33.18 | +0.47 |
| Prev. Close | Volume | Bid | Ask | Time |
| 36.34 | 0 | 35.89 | 35.89 | 2026-03-19 00:00:00 |
| 52wk High | 35.8 | 52wk High Date | 2026-02-26 |
| 52wk Low | 26.66 | 52wk Low Date | 2025-04-08 |
| Year End Close | 31.2 | Payment Date | 2019-12-16 |