Stock Trend Analysis Report
Prepared for you on Saturday, March 28, 2026.
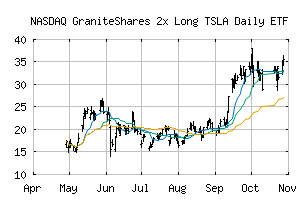
GraniteShares 2x Long TSLA Daily ETF (NASDAQ:TSLR)
Strong Downtrend (-100) - TSLR is in a strong downtrend that is likely to continue. With short-term, intermediate, and long-term bearish momentum, TSLR continues to fall. Traders should use caution and set stops.
Is it time to buy, sell, or avoid TSLR?
MarketClub looks at technical strength and momentum to determine if the timing is right for TSLR.
Learn more about the Trade Triangles and how we make technical analysis as easy as buy and sell.
|
|||||||||||||||
|
|||||||||||||||
MarketClub’s Trade Triangles for TSLR
![]() The long-term trend has been DOWN since Feb 5th, 2026 at 23.890
The long-term trend has been DOWN since Feb 5th, 2026 at 23.890
![]() The intermediate-term trend has been DOWN since Jan 2nd, 2026 at 30.450
The intermediate-term trend has been DOWN since Jan 2nd, 2026 at 30.450
![]() The short-term trend has been DOWN since Mar 26th, 2026 at 21.025
The short-term trend has been DOWN since Mar 26th, 2026 at 21.025
Smart Scan Analysis for TSLR
Based on our trend formula, TSLR is rated as a -100 on a scale from -100 (Strong Downtrend) to +100 (Strong Uptrend).
| Open | High | Low | Price | Change |
|---|---|---|---|---|
| 20.43 | 20.52 | 19.39 | 19.71 | -1.10 |
| Prev. Close | Volume | Bid | Ask | Time |
| 19.64 | 1807907 | 2026-03-27 15:59:40 |
| 52wk High | 39.54 | 52wk High Date | 2025-12-22 |
| 52wk Low | 9.97 | 52wk Low Date | 2025-04-07 |
| Average Volume | 1,587,490 |