Mutual Trend Analysis Report
Prepared for you on Thursday, March 19, 2026.
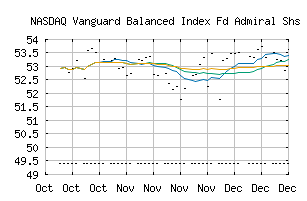
Vanguard Balanced Index Fd Admiral Shs (NASDAQ:VBIAX)
Countertrend Up (+85) - VBIAX is showing short-term weakness. However, look for the longer-term bullish trend to resume. As always, continue to monitor the trend score and utilize a stop order.
Is it time to buy, sell, or avoid VBIAX?
MarketClub looks at technical strength and momentum to determine if the timing is right for VBIAX.
Learn more about the Trade Triangles and how we make technical analysis as easy as buy and sell.
|
|||||||||||||||
|
|||||||||||||||
MarketClub’s Trade Triangles for VBIAX
![]() The long-term trend has been UP since Dec 1st, 2023 at 43.68
The long-term trend has been UP since Dec 1st, 2023 at 43.68
![]() The intermediate-term trend has been UP since Aug 15th, 2024 at 48.33
The intermediate-term trend has been UP since Aug 15th, 2024 at 48.33
![]() The short-term trend has been UP since Sep 19th, 2024 at 49.56
The short-term trend has been UP since Sep 19th, 2024 at 49.56
Smart Scan Analysis for VBIAX
Based on our trend formula, VBIAX is rated as a +80 on a scale from -100 (Strong Downtrend) to +100 (Strong Uptrend).
| Open | High | Low | Price | Change |
|---|---|---|---|---|
| 49.42 | 49.42 | 49.42 | 51.69 | +0.53 |
| Prev. Close | Volume | Bid | Ask | Time |
| 49.95 | 0 | 49.95 | 49.95 | 2026-03-19 00:00:00 |
| 52wk High | 53.74 | 52wk High Date | 2025-12-11 |
| 52wk Low | 43.37 | 52wk Low Date | 2025-04-09 |
| Year End Close | 44.58 | Payment Date | 2023-03-23 |