Stock Trend Analysis Report
Prepared for you on Monday, March 30, 2026.
Vanguard International High Dividend Yield ETF (NASDAQ:VYMI)
Weak Downtrend (-65) - VYMI is showing signs of a strengthening downtrend. Monitor VYMI as it may be building momentum to the downside.
Is it time to buy, sell, or avoid VYMI?
MarketClub looks at technical strength and momentum to determine if the timing is right for VYMI.
Learn more about the Trade Triangles and how we make technical analysis as easy as buy and sell.
|
|||||||||||||||
|
|||||||||||||||
MarketClub’s Trade Triangles for VYMI
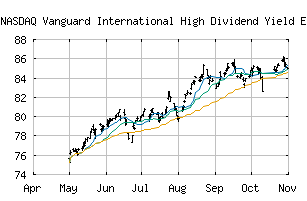
![]() The long-term trend has been UP since May 2nd, 2025 at 76.027
The long-term trend has been UP since May 2nd, 2025 at 76.027
![]() The intermediate-term trend has been DOWN since Mar 3rd, 2026 at 98.004
The intermediate-term trend has been DOWN since Mar 3rd, 2026 at 98.004
![]() The short-term trend has been DOWN since Mar 27th, 2026 at 91.330
The short-term trend has been DOWN since Mar 27th, 2026 at 91.330
Smart Scan Analysis for VYMI
Based on our trend formula, VYMI is rated as a -70 on a scale from -100 (Strong Downtrend) to +100 (Strong Uptrend).
| Open | High | Low | Price | Change |
|---|---|---|---|---|
| 92.04 | 92.46 | 91.37 | 91.70 | +0.26 |
| Prev. Close | Volume | Bid | Ask | Time |
| 91.44 | 1045465 | 2026-03-30 15:59:57 |
| Year High | 72.3203 | Year High Date | 2018-01-25 |
| Year Low | 57.225 | Year Low Date | 2018-10-26 |
| 52wk High | 101.71 | 52wk High Date | 2026-02-25 |
| 52wk Low | 65.08 | 52wk Low Date | 2025-04-07 |
| Average Volume | 1,672,010 | Shares Outstanding | 300 |
| Volatility | 17.03 |