Index Trend Analysis Report
Prepared for you on Friday, November 22, 2024.
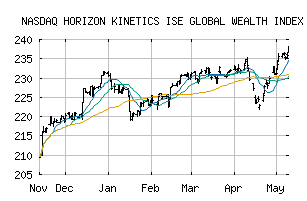
HORIZON KINETICS ISE GLOBAL WEALTH INDEX (NASDAQ:WEALTHGL)
Weak Downtrend (-65) - WEALTHGL is showing signs of a strengthening downtrend. Monitor WEALTHGL as it may be building momentum to the downside.
Is it time to buy, sell, or avoid WEALTHGL?
MarketClub looks at technical strength and momentum to determine if the timing is right for WEALTHGL.
Learn more about the Trade Triangles and how we make technical analysis as easy as buy and sell.
|
|||||||||||||||
|
|||||||||||||||
MarketClub’s Trade Triangles for WEALTHGL
![]() The long-term trend has been UP since Sep 17th, 2024 at 243.71
The long-term trend has been UP since Sep 17th, 2024 at 243.71
![]() The intermediate-term trend has been DOWN since Oct 21st, 2024 at 248.02
The intermediate-term trend has been DOWN since Oct 21st, 2024 at 248.02
![]() The short-term trend has been DOWN since Nov 21st, 2024 at 235.81
The short-term trend has been DOWN since Nov 21st, 2024 at 235.81
Smart Scan Analysis for WEALTHGL
Based on our trend formula, WEALTHGL is rated as a -70 on a scale from -100 (Strong Downtrend) to +100 (Strong Uptrend).
| Open | High | Low | Price | Change |
|---|---|---|---|---|
| 236.22 | 236.66 | 235.82 | 236.27 | 0.00 |
| Prev. Close | Volume | Bid | Ask | Time |
| 236.22 | 0 | 2024-11-22 07:01:00 |
| 52wk High | 210.79 | 52wk High Date | 2018-01-29 |
| 52wk Low | 160.7 | 52wk Low Date | 2018-10-26 |