Mutual Trend Analysis Report
Prepared for you on Monday, March 30, 2026.
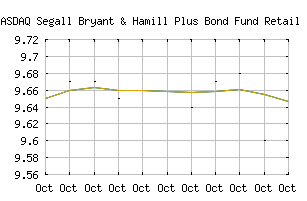
Segall Bryant & Hamill Plus Bond Fund Retail Class (NASDAQ:WTIBX)
Countertrend Up (+85) - WTIBX is showing short-term weakness. However, look for the longer-term bullish trend to resume. As always, continue to monitor the trend score and utilize a stop order.
Is it time to buy, sell, or avoid WTIBX?
MarketClub looks at technical strength and momentum to determine if the timing is right for WTIBX.
Learn more about the Trade Triangles and how we make technical analysis as easy as buy and sell.
|
|||||||||||||||
|
|||||||||||||||
MarketClub’s Trade Triangles for WTIBX
![]() The long-term trend has been UP since Jul 5th, 2024 at 9.31
The long-term trend has been UP since Jul 5th, 2024 at 9.31
![]() The intermediate-term trend has been UP since Jul 3rd, 2024 at 9.28
The intermediate-term trend has been UP since Jul 3rd, 2024 at 9.28
![]() The short-term trend has been UP since Oct 20th, 2025 at 9.71
The short-term trend has been UP since Oct 20th, 2025 at 9.71
Smart Scan Analysis for WTIBX
Based on our trend formula, WTIBX is rated as a +80 on a scale from -100 (Strong Downtrend) to +100 (Strong Uptrend).
| Open | High | Low | Price | Change |
|---|---|---|---|---|
| 9.72 | 9.72 | 9.72 | 9.44 | +0.03 |
| Prev. Close | Volume | Bid | Ask | Time |
| 9.71 | 0 | 9.75 | 9.75 | 2026-03-30 00:00:00 |
| 52wk High | 9.68 | 52wk High Date | 2026-02-23 |
| 52wk Low | 9.23 | 52wk Low Date | 2025-05-21 |
| Year End Close | 9.46 | Payment Date | 2026-03-30 |