Index Trend Analysis Report
Prepared for you on Sunday, December 7, 2025.
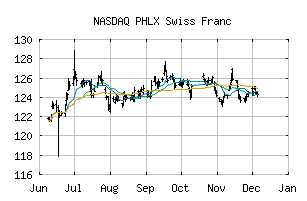
PHLX Swiss Franc (NASDAQ:XDS)
Weak Uptrend (+65) - XDS is showing signs of weakening momentum to the upside. Monitor XDS as it may be in the beginning stages of a reversal.
Is it time to buy, sell, or avoid XDS?
MarketClub looks at technical strength and momentum to determine if the timing is right for XDS.
Learn more about the Trade Triangles and how we make technical analysis as easy as buy and sell.
|
|||||||||||||||
|
|||||||||||||||
MarketClub’s Trade Triangles for XDS
![]() The long-term trend has been UP since Apr 9th, 2025 at 119.261
The long-term trend has been UP since Apr 9th, 2025 at 119.261
![]() The intermediate-term trend has been UP since Nov 14th, 2025 at 126.490
The intermediate-term trend has been UP since Nov 14th, 2025 at 126.490
![]() The short-term trend has been DOWN since Dec 5th, 2025 at 124.190
The short-term trend has been DOWN since Dec 5th, 2025 at 124.190
Smart Scan Analysis for XDS
Based on our trend formula, XDS is rated as a +65 on a scale from -100 (Strong Downtrend) to +100 (Strong Uptrend).
| Open | High | Low | Price | Change |
|---|---|---|---|---|
| 124.38 | 124.58 | 124.13 | 124.33 | -0.13 |
| Prev. Close | Volume | Bid | Ask | Time |
| 124.33 | 0 | 2025-12-05 17:15:16 |
| 52wk High | 108.58 | 52wk High Date | 2018-02-15 |
| 52wk Low | 98.88 | 52wk Low Date | 2018-11-12 |