Index Trend Analysis Report
Prepared for you on Thursday, July 31, 2025.
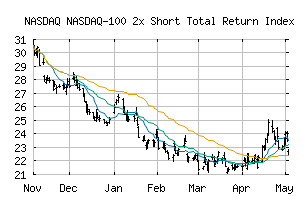
NASDAQ-100 2x Short Total Return Index (NASDAQ:XNDXS2)
Strong Downtrend (-100) - XNDXS2 is in a strong downtrend that is likely to continue. With short-term, intermediate, and long-term bearish momentum, XNDXS2 continues to fall. Traders should use caution and set stops.
Is it time to buy, sell, or avoid XNDXS2?
MarketClub looks at technical strength and momentum to determine if the timing is right for XNDXS2.
Learn more about the Trade Triangles and how we make technical analysis as easy as buy and sell.
|
|||||||||||||||
|
|||||||||||||||
MarketClub’s Trade Triangles for XNDXS2
![]() The long-term trend has been DOWN since May 13th, 2025 at 14.920
The long-term trend has been DOWN since May 13th, 2025 at 14.920
![]() The intermediate-term trend has been DOWN since Apr 24th, 2025 at 18.331
The intermediate-term trend has been DOWN since Apr 24th, 2025 at 18.331
![]() The short-term trend has been DOWN since Jul 17th, 2025 at 12.772
The short-term trend has been DOWN since Jul 17th, 2025 at 12.772
Smart Scan Analysis for XNDXS2
Based on our trend formula, XNDXS2 is rated as a -100 on a scale from -100 (Strong Downtrend) to +100 (Strong Uptrend).
| Open | High | Low | Price | Change |
|---|---|---|---|---|
| 12.521 | 12.640 | 12.403 | 12.512 | -0.036 |
| Prev. Close | Volume | Bid | Ask | Time |
| 12.512 | 0 | 2025-07-30 17:13:00 |