Mutual Trend Analysis Report
Prepared for you on Saturday, April 18, 2026.
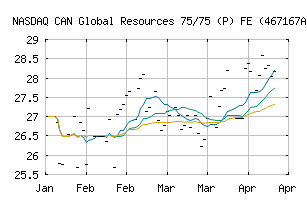
CAN Global Resources 75/75 (P) FE (467167A2) (NASDAQ:ZANYPX)
Long-Term Uptrend (+90) - ZANYPX is in a strong uptrend that is likely to continue. While ZANYPX is showing intraday weakness, it remains in the confines of a bullish trend. Traders should use caution and utilize a stop order.
Is it time to buy, sell, or avoid ZANYPX?
MarketClub looks at technical strength and momentum to determine if the timing is right for ZANYPX.
Learn more about the Trade Triangles and how we make technical analysis as easy as buy and sell.
|
|||||||||||||||
|
|||||||||||||||
MarketClub’s Trade Triangles for ZANYPX
![]() The long-term trend has been UP since Feb 13th, 2026 at 27.0118
The long-term trend has been UP since Feb 13th, 2026 at 27.0118
![]() The intermediate-term trend has been UP since Mar 31st, 2026 at 27.6447
The intermediate-term trend has been UP since Mar 31st, 2026 at 27.6447
![]() The short-term trend has been UP since Apr 14th, 2026 at 28.1795
The short-term trend has been UP since Apr 14th, 2026 at 28.1795
Smart Scan Analysis for ZANYPX
Based on our trend formula, ZANYPX is rated as a +90 on a scale from -100 (Strong Downtrend) to +100 (Strong Uptrend).
| Open | High | Low | Price | Change |
|---|---|---|---|---|
| 28.1795 | 28.1795 | 28.1795 | 28.1795 | -0.1052 |
| Prev. Close | Volume | Bid | Ask | Time |
| 28.1795 | 0 | 2026-04-18 00:00:00 |