Mutual Trend Analysis Report
Prepared for you on Saturday, April 4, 2026.
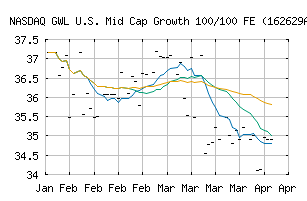
GWL U.S. Mid Cap Growth 100/100 FE (162629A2) (NASDAQ:ZEKCRX)
Long-Term Downtrend (-90) - ZEKCRX is in a strong downtrend that is likely to continue. While ZEKCRX is showing intraday strength, it remains in the confines of a bearish trend. Traders should use caution and set stops.
Is it time to buy, sell, or avoid ZEKCRX?
MarketClub looks at technical strength and momentum to determine if the timing is right for ZEKCRX.
Learn more about the Trade Triangles and how we make technical analysis as easy as buy and sell.
|
|||||||||||||||
|
|||||||||||||||
MarketClub’s Trade Triangles for ZEKCRX
![]() The long-term trend has been DOWN since Mar 13th, 2026 at 35.4846
The long-term trend has been DOWN since Mar 13th, 2026 at 35.4846
![]() The intermediate-term trend has been DOWN since Mar 11th, 2026 at 35.7931
The intermediate-term trend has been DOWN since Mar 11th, 2026 at 35.7931
![]() The short-term trend has been DOWN since Mar 29th, 2026 at 34.9082
The short-term trend has been DOWN since Mar 29th, 2026 at 34.9082
Smart Scan Analysis for ZEKCRX
Based on our trend formula, ZEKCRX is rated as a -90 on a scale from -100 (Strong Downtrend) to +100 (Strong Uptrend).
| Open | High | Low | Price | Change |
|---|---|---|---|---|
| 34.9082 | 34.9082 | 34.9082 | 34.9082 | +0.3118 |
| Prev. Close | Volume | Bid | Ask | Time |
| 34.9082 | 0 | 2026-04-04 00:00:00 |