Mutual Trend Analysis Report
Prepared for you on Tuesday, April 14, 2026.
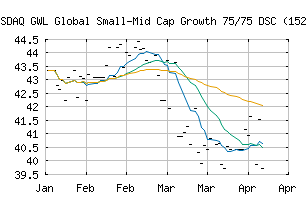
GWL Global Small-Mid Cap Growth 75/75 DSC (152616A3) (NASDAQ:ZEKYCX)
Long-Term Downtrend (-90) - ZEKYCX is in a strong downtrend that is likely to continue. While ZEKYCX is showing intraday strength, it remains in the confines of a bearish trend. Traders should use caution and set stops.
Is it time to buy, sell, or avoid ZEKYCX?
MarketClub looks at technical strength and momentum to determine if the timing is right for ZEKYCX.
Learn more about the Trade Triangles and how we make technical analysis as easy as buy and sell.
|
|||||||||||||||
|
|||||||||||||||
MarketClub’s Trade Triangles for ZEKYCX
![]() The long-term trend has been DOWN since Mar 13th, 2026 at 42.2224
The long-term trend has been DOWN since Mar 13th, 2026 at 42.2224
![]() The intermediate-term trend has been DOWN since Mar 10th, 2026 at 43.0787
The intermediate-term trend has been DOWN since Mar 10th, 2026 at 43.0787
![]() The short-term trend has been DOWN since Apr 12th, 2026 at 40.9538
The short-term trend has been DOWN since Apr 12th, 2026 at 40.9538
Smart Scan Analysis for ZEKYCX
Based on our trend formula, ZEKYCX is rated as a -90 on a scale from -100 (Strong Downtrend) to +100 (Strong Uptrend).
| Open | High | Low | Price | Change |
|---|---|---|---|---|
| 39.7151 | 39.7151 | 39.7151 | 39.7151 | +0.8346 |
| Prev. Close | Volume | Bid | Ask | Time |
| 39.7151 | 0 | 2026-04-14 00:00:00 |