Mutual Trend Analysis Report
Prepared for you on Monday, February 9, 2026.
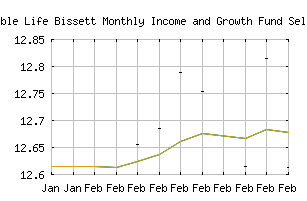
Equitable Life Bissett Monthly Income and Growth Fund Select CB (322055A16) (NASDAQ:ZENEXX)
Weak Uptrend (+65) - ZENEXX is showing signs of weakening momentum to the upside. Monitor ZENEXX as it may be in the beginning stages of a reversal.
Is it time to buy, sell, or avoid ZENEXX?
MarketClub looks at technical strength and momentum to determine if the timing is right for ZENEXX.
Learn more about the Trade Triangles and how we make technical analysis as easy as buy and sell.
|
|||||||||||||||
|
|||||||||||||||
MarketClub’s Trade Triangles for ZENEXX
![]() The long-term trend has been UP since Feb 3rd, 2026 at 12.6140
The long-term trend has been UP since Feb 3rd, 2026 at 12.6140
![]() The intermediate-term trend has been UP since Feb 3rd, 2026 at 12.6140
The intermediate-term trend has been UP since Feb 3rd, 2026 at 12.6140
![]() The short-term trend has been DOWN since Feb 8th, 2026 at 12.6857
The short-term trend has been DOWN since Feb 8th, 2026 at 12.6857
Smart Scan Analysis for ZENEXX
Based on our trend formula, ZENEXX is rated as a +65 on a scale from -100 (Strong Downtrend) to +100 (Strong Uptrend).
| Open | High | Low | Price | Change |
|---|---|---|---|---|
| 12.7541 | 12.7541 | 12.7541 | 12.7541 | +0.0615 |
| Prev. Close | Volume | Bid | Ask | Time |
| 12.7541 | 0 | 2026-02-09 00:00:00 |