Mutual Trend Analysis Report
Prepared for you on Sunday, April 5, 2026.
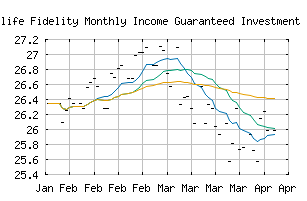
Manulife Fidelity Monthly Income Guaranteed Investment Fund Select DSC (NASDAQ:ZIKSWX)
Countertrend Down (-85) - ZIKSWX is showing short-term strength. However, look for the longer-term bearish trend to resume. As always, continue to monitor the trend score and set stops.
Is it time to buy, sell, or avoid ZIKSWX?
MarketClub looks at technical strength and momentum to determine if the timing is right for ZIKSWX.
Learn more about the Trade Triangles and how we make technical analysis as easy as buy and sell.
|
|||||||||||||||
|
|||||||||||||||
MarketClub’s Trade Triangles for ZIKSWX
![]() The long-term trend has been DOWN since Mar 13th, 2026 at 26.0878
The long-term trend has been DOWN since Mar 13th, 2026 at 26.0878
![]() The intermediate-term trend has been DOWN since Mar 12th, 2026 at 26.2842
The intermediate-term trend has been DOWN since Mar 12th, 2026 at 26.2842
![]() The short-term trend has been UP since Apr 1st, 2026 at 25.9316
The short-term trend has been UP since Apr 1st, 2026 at 25.9316
Smart Scan Analysis for ZIKSWX
Based on our trend formula, ZIKSWX is rated as a -85 on a scale from -100 (Strong Downtrend) to +100 (Strong Uptrend).
| Open | High | Low | Price | Change |
|---|---|---|---|---|
| 25.9826 | 25.9826 | 25.9826 | 25.9826 | -0.2178 |
| Prev. Close | Volume | Bid | Ask | Time |
| 25.9826 | 0 | 2026-04-05 00:00:00 |