Stock Trend Analysis Report
Prepared for you on Thursday, February 12, 2026.
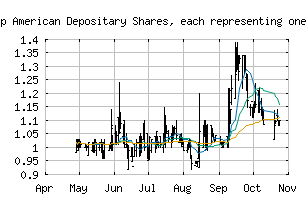
AMTD IDEA Group American Depositary Shares, each representing one Class A Ordinary Share (NYSE:AMTD)
Countertrend Down (-85) - AMTD is showing short-term strength. However, look for the longer-term bearish trend to resume. As always, continue to monitor the trend score and set stops.
Is it time to buy, sell, or avoid AMTD?
MarketClub looks at technical strength and momentum to determine if the timing is right for AMTD.
Learn more about the Trade Triangles and how we make technical analysis as easy as buy and sell.
|
|||||||||||||||
|
|||||||||||||||
MarketClub’s Trade Triangles for AMTD
![]() The long-term trend has been DOWN since Nov 7th, 2025 at 0.92
The long-term trend has been DOWN since Nov 7th, 2025 at 0.92
![]() The intermediate-term trend has been DOWN since Dec 29th, 2025 at 1.00
The intermediate-term trend has been DOWN since Dec 29th, 2025 at 1.00
![]() The short-term trend has been UP since Feb 11th, 2026 at 1.01
The short-term trend has been UP since Feb 11th, 2026 at 1.01
Smart Scan Analysis for AMTD
Based on our trend formula, AMTD is rated as a -85 on a scale from -100 (Strong Downtrend) to +100 (Strong Uptrend).
| Open | High | Low | Price | Change |
|---|---|---|---|---|
| 1.00000 | 1.02000 | 0.97160 | 0.99505 | -0.00495 |
| Prev. Close | Volume | Bid | Ask | Time |
| 1.00000 | 56125 | 2026-02-12 15:51:37 |
| 52wk High | 1.65 | 52wk High Date | 2025-10-31 |
| 52wk Low | 0.8742 | 52wk Low Date | 2025-11-13 |
| Average Volume | 27,877 | Assets | 206,991,800M |
| Liabilities | 478,013,000M |