Stock Trend Analysis Report
Prepared for you on Tuesday, October 22, 2024.
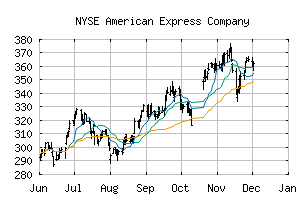
American Express Company (NYSE:AXP)
Weak Uptrend (+65) - AXP is showing signs of weakening momentum to the upside. Monitor AXP as it may be in the beginning stages of a reversal.
Is it time to buy, sell, or avoid AXP?
MarketClub looks at technical strength and momentum to determine if the timing is right for AXP.
Learn more about the Trade Triangles and how we make technical analysis as easy as buy and sell.
|
|||||||||||||||
|
|||||||||||||||
MarketClub’s Trade Triangles for AXP
![]() The long-term trend has been UP since Nov 30th, 2023 at 169.805
The long-term trend has been UP since Nov 30th, 2023 at 169.805
![]() The intermediate-term trend has been UP since Sep 16th, 2024 at 261.750
The intermediate-term trend has been UP since Sep 16th, 2024 at 261.750
![]() The short-term trend has been DOWN since Oct 18th, 2024 at 276.900
The short-term trend has been DOWN since Oct 18th, 2024 at 276.900
Smart Scan Analysis for AXP
Based on our trend formula, AXP is rated as a +65 on a scale from -100 (Strong Downtrend) to +100 (Strong Uptrend).
+65
Strong Downtrend
Sideways
Strong Uptrend
| Open | High | Low | Price | Change |
|---|---|---|---|---|
| 270.620 | 272.830 | 268.580 | 272.775 | +2.035 |
| Prev. Close | Volume | Bid | Ask | Time |
| 270.740 | 1949325 | 2024-10-22 15:57:56 |
| Year High | 113.18 | Year High Date | 2018-11-28 |
| Year Low | 87.54 | Year Low Date | 2018-02-09 |
| 52wk High | 286.36 | 52wk High Date | 2024-10-17 |
| 52wk Low | 140.91 | 52wk Low Date | 2023-10-23 |
| Year End Close | 57.48 | Average Volume | 2,622,074 |
| Shares Outstanding | 704,445 | Short Interest | 9,389,555 |
| % Institutional | 89.8 | Market Cap | 97,901M |
| Assets | 270,979,000M | Liabilities | 241,272,000M |
| P/E Ratio | 19.922 | Beta | 1.01 |
| Volatility | 26.24 |
Get a free daily analysis and signals for American Express Company (AXP) - Request Your Free Report.