Stock Trend Analysis Report
Prepared for you on Tuesday, October 22, 2024.
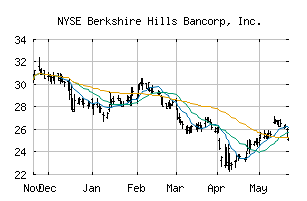
Berkshire Hills Bancorp, Inc. (NYSE:BHLB)
Countertrend Up (+85) - BHLB is showing short-term weakness. However, look for the longer-term bullish trend to resume. As always, continue to monitor the trend score and utilize a stop order.
Is it time to buy, sell, or avoid BHLB?
MarketClub looks at technical strength and momentum to determine if the timing is right for BHLB.
Learn more about the Trade Triangles and how we make technical analysis as easy as buy and sell.
|
|||||||||||||||
|
|||||||||||||||
MarketClub’s Trade Triangles for BHLB
![]() The long-term trend has been UP since Jul 11th, 2024 at 23.6504
The long-term trend has been UP since Jul 11th, 2024 at 23.6504
![]() The intermediate-term trend has been UP since Oct 15th, 2024 at 27.6900
The intermediate-term trend has been UP since Oct 15th, 2024 at 27.6900
![]() The short-term trend has been DOWN since Oct 21st, 2024 at 27.9400
The short-term trend has been DOWN since Oct 21st, 2024 at 27.9400
Smart Scan Analysis for BHLB
Based on our trend formula, BHLB is rated as a +85 on a scale from -100 (Strong Downtrend) to +100 (Strong Uptrend).
| Open | High | Low | Price | Change |
|---|---|---|---|---|
| 27.230 | 27.385 | 27.100 | 27.330 | +0.060 |
| Prev. Close | Volume | Bid | Ask | Time |
| 27.270 | 70608 | 2024-10-22 15:57:04 |
| Year High | 44.25 | Year High Date | 2018-07-19 |
| Year Low | 32.34 | Year Low Date | 2018-10-24 |
| 52wk High | 28.51 | 52wk High Date | 2024-07-25 |
| 52wk Low | 18.31 | 52wk Low Date | 2023-10-25 |
| Year End Close | 23.86 | Average Volume | 206,844 |
| Shares Outstanding | 42,984 | Short Interest | 777,878 |
| % Institutional | 76.6 | Market Cap | 1,590M |
| Assets | 122,194,540M | Liabilities | 112,065,120M |
| P/E Ratio | 52.4423 | Beta | 0.88 |
| Volatility | 29.49 |