Stock Trend Analysis Report
Prepared for you on Friday, April 26, 2024.
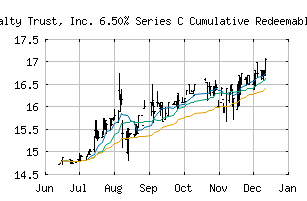
Cedar Realty Trust, Inc. 6.50% Series C Cumulative Redeemable Preferred Stock (NYSE:CDR.PR.C)
Strong Downtrend (-100) - CDR.PR.C is in a strong downtrend that is likely to continue. With short-term, intermediate, and long-term bearish momentum, CDR.PR.C continues to fall. Traders should use caution and set stops.
Is it time to buy, sell, or avoid CDR.PR.C?
MarketClub looks at technical strength and momentum to determine if the timing is right for CDR.PR.C.
Learn more about the Trade Triangles and how we make technical analysis as easy as buy and sell.
|
|||||||||||||||
|
|||||||||||||||
MarketClub’s Trade Triangles for CDR.PR.C
![]() The long-term trend has been DOWN since Apr 10th, 2024 at 11.3016
The long-term trend has been DOWN since Apr 10th, 2024 at 11.3016
![]() The intermediate-term trend has been DOWN since Mar 28th, 2024 at 13.0901
The intermediate-term trend has been DOWN since Mar 28th, 2024 at 13.0901
![]() The short-term trend has been DOWN since Apr 24th, 2024 at 11.5900
The short-term trend has been DOWN since Apr 24th, 2024 at 11.5900
Smart Scan Analysis for CDR.PR.C
Based on our trend formula, CDR.PR.C is rated as a -100 on a scale from -100 (Strong Downtrend) to +100 (Strong Uptrend).
| Open | High | Low | Price | Change |
|---|---|---|---|---|
| 11.9800 | 11.9800 | 11.5000 | 11.7500 | -0.2499 |
| Prev. Close | Volume | Bid | Ask | Time |
| 11.7500 | 2583 | 2024-04-25 15:59:47 |
| Year High | 25.02 | Year High Date | 2018-01-02 |
| Year Low | 18.09 | Year Low Date | 2018-11-27 |
| 52wk High | 15.15 | 52wk High Date | 2023-08-08 |
| 52wk Low | 10.1801 | 52wk Low Date | 2023-10-30 |
| Average Volume | 16,629 | Assets | 233,082,000M |
| Liabilities | 159,625,000M | Volatility | 25.2 |