Stock Trend Analysis Report
Prepared for you on Friday, October 31, 2025.
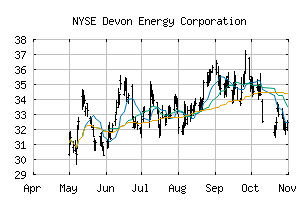
Devon Energy Corporation (NYSE:DVN)
Crossroads (-60) - DVN is struggling to move into a solid trend. Beware of choppy markets and consider a sidelines position until a stronger trend is identified.
Is it time to buy, sell, or avoid DVN?
MarketClub looks at technical strength and momentum to determine if the timing is right for DVN.
Learn more about the Trade Triangles and how we make technical analysis as easy as buy and sell.
|
|||||||||||||||
|
|||||||||||||||
MarketClub’s Trade Triangles for DVN
![]() The long-term trend has been UP since Aug 25th, 2025 at 35.6000
The long-term trend has been UP since Aug 25th, 2025 at 35.6000
![]() The intermediate-term trend has been DOWN since Oct 10th, 2025 at 33.5800
The intermediate-term trend has been DOWN since Oct 10th, 2025 at 33.5800
![]() The short-term trend has been DOWN since Oct 28th, 2025 at 32.7924
The short-term trend has been DOWN since Oct 28th, 2025 at 32.7924
Smart Scan Analysis for DVN
Based on our trend formula, DVN is rated as a -60 on a scale from -100 (Strong Downtrend) to +100 (Strong Uptrend).
| Open | High | Low | Price | Change |
|---|---|---|---|---|
| 32.120 | 32.570 | 31.940 | 32.545 | +0.535 |
| Prev. Close | Volume | Bid | Ask | Time |
| 32.010 | 3642401 | 2025-10-31 15:46:34 |
| Year High | 46.5425 | Year High Date | 2018-07-10 |
| Year Low | 25.87 | Year Low Date | 2018-11-28 |
| 52wk High | 40.54 | 52wk High Date | 2024-11-06 |
| 52wk Low | 25.89 | 52wk Low Date | 2025-04-09 |
| Year End Close | 52.04 | Average Volume | 7,033,847 |
| Shares Outstanding | 634,800 | Short Interest | 8,205,949 |
| % Institutional | 78.4 | Market Cap | 10,092M |
| Assets | 313,900,000M | Liabilities | 163,300,000M |
| P/E Ratio | 7.1933 | Beta | 1.29 |
| Volatility | 45.81 |