Stock Trend Analysis Report
Prepared for you on Thursday, April 25, 2024.
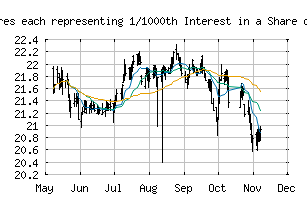
Goldman Sachs Group, Inc. (The) Depositary Shares each representing 1/1000th Interest in a Share of Floating Rate Non-Cumulative Preferred Stock Series A (NYSE:GS.PR.A)
Crossroads (-60) - GS.PR.A is struggling to move into a solid trend. Beware of choppy markets and consider a sidelines position until a stronger trend is identified.
Is it time to buy, sell, or avoid GS.PR.A?
MarketClub looks at technical strength and momentum to determine if the timing is right for GS.PR.A.
Learn more about the Trade Triangles and how we make technical analysis as easy as buy and sell.
|
|||||||||||||||
|
|||||||||||||||
MarketClub’s Trade Triangles for GS.PR.A
![]() The long-term trend has been UP since Feb 1st, 2023 at 20.3599
The long-term trend has been UP since Feb 1st, 2023 at 20.3599
![]() The intermediate-term trend has been DOWN since Apr 15th, 2024 at 22.7700
The intermediate-term trend has been DOWN since Apr 15th, 2024 at 22.7700
![]() The short-term trend has been DOWN since Apr 24th, 2024 at 22.5000
The short-term trend has been DOWN since Apr 24th, 2024 at 22.5000
Smart Scan Analysis for GS.PR.A
Based on our trend formula, GS.PR.A is rated as a -60 on a scale from -100 (Strong Downtrend) to +100 (Strong Uptrend).
| Open | High | Low | Price | Change |
|---|---|---|---|---|
| 22.32000 | 22.57000 | 22.30000 | 22.49000 | +0.09579 |
| Prev. Close | Volume | Bid | Ask | Time |
| 22.49000 | 54855 | 2024-04-24 15:58:01 |
| Year High | 23.965 | Year High Date | 2018-07-03 |
| Year Low | 19.24 | Year Low Date | 2018-11-29 |
| 52wk High | 23.88 | 52wk High Date | 2024-03-22 |
| 52wk Low | 19.17 | 52wk Low Date | 2023-05-04 |
| Year End Close | 20.69 | Average Volume | 45,607 |
| Short Interest | 43,891 | Assets | 164,159,400M |
| Liabilities | 152,468,900M | P/E Ratio | 0.9961 |
| Beta | 0.59 | Volatility | 12.63 |