Stock Trend Analysis Report
Prepared for you on Saturday, February 28, 2026.
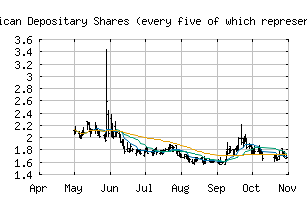
AMTD Digital Inc. American Depositary Shares (every five of which represent two Class A Ordinary Shares) (NYSE:HKD)
Crossroads (+60) - HKD is struggling to move into a solid trend. Beware of choppy markets and consider a sidelines position until a stronger trend is identified.
Is it time to buy, sell, or avoid HKD?
MarketClub looks at technical strength and momentum to determine if the timing is right for HKD.
Learn more about the Trade Triangles and how we make technical analysis as easy as buy and sell.
|
|||||||||||||||
|
|||||||||||||||
MarketClub’s Trade Triangles for HKD
![]() The long-term trend has been DOWN since Nov 14th, 2025 at 1.56
The long-term trend has been DOWN since Nov 14th, 2025 at 1.56
![]() The intermediate-term trend has been UP since Feb 10th, 2026 at 1.63
The intermediate-term trend has been UP since Feb 10th, 2026 at 1.63
![]() The short-term trend has been UP since Feb 10th, 2026 at 1.63
The short-term trend has been UP since Feb 10th, 2026 at 1.63
Smart Scan Analysis for HKD
Based on our trend formula, HKD is rated as a +60 on a scale from -100 (Strong Downtrend) to +100 (Strong Uptrend).
| Open | High | Low | Price | Change |
|---|---|---|---|---|
| 1.76 | 1.80 | 1.71 | 1.75 | -0.01 |
| Prev. Close | Volume | Bid | Ask | Time |
| 1.75 | 316403 | 2026-02-27 15:58:54 |
| 52wk High | 5.47 | 52wk High Date | 2025-10-31 |
| 52wk Low | 1.26 | 52wk Low Date | 2025-12-31 |
| Average Volume | 360,275 | Assets | 322,164,600M |
| Liabilities | 137,661,000M |