Stock Trend Analysis Report
Prepared for you on Thursday, December 26, 2024.
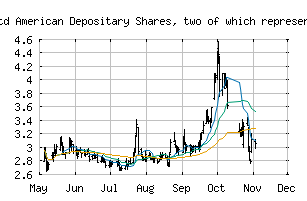
Lufax Holding Ltd American Depositary Shares, each representing two (2) Ordinary Shares (NYSE:LU)
Weak Uptrend (+65) - LU is showing signs of weakening momentum to the upside. Monitor LU as it may be in the beginning stages of a reversal.
Is it time to buy, sell, or avoid LU?
MarketClub looks at technical strength and momentum to determine if the timing is right for LU.
Learn more about the Trade Triangles and how we make technical analysis as easy as buy and sell.
|
|||||||||||||||
|
|||||||||||||||
MarketClub’s Trade Triangles for LU
![]() The long-term trend has been UP since Oct 2nd, 2024 at 3.75
The long-term trend has been UP since Oct 2nd, 2024 at 3.75
![]() The intermediate-term trend has been UP since Dec 6th, 2024 at 2.67
The intermediate-term trend has been UP since Dec 6th, 2024 at 2.67
![]() The short-term trend has been DOWN since Dec 12th, 2024 at 2.62
The short-term trend has been DOWN since Dec 12th, 2024 at 2.62
Smart Scan Analysis for LU
Based on our trend formula, LU is rated as a +65 on a scale from -100 (Strong Downtrend) to +100 (Strong Uptrend).
| Open | High | Low | Price | Change |
|---|---|---|---|---|
| 2.380 | 2.470 | 2.380 | 2.445 | +0.055 |
| Prev. Close | Volume | Bid | Ask | Time |
| 2.390 | 1079751 | 2024-12-26 12:49:34 |
| 52wk High | 4.9399 | 52wk High Date | 2024-04-26 |
| 52wk Low | 2 | 52wk Low Date | 2024-06-04 |
| Average Volume | 3,869,710 | Assets | 206,449,110M |
| Liabilities | 121,902,167M | P/E Ratio | 0.803 |