Stock Trend Analysis Report
Prepared for you on Sunday, June 15, 2025.
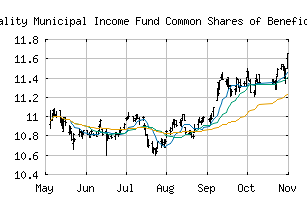
Nuveen AMT-Free Quality Municipal Income Fund Common Shares of Beneficial Interest Par Value $.01 (NYSE:NEA)
Weak Downtrend (-65) - NEA is showing signs of a strengthening downtrend. Monitor NEA as it may be building momentum to the downside.
Is it time to buy, sell, or avoid NEA?
MarketClub looks at technical strength and momentum to determine if the timing is right for NEA.
Learn more about the Trade Triangles and how we make technical analysis as easy as buy and sell.
|
|||||||||||||||
|
|||||||||||||||
MarketClub’s Trade Triangles for NEA
![]() The long-term trend has been DOWN since Nov 1st, 2024 at 11.4600
The long-term trend has been DOWN since Nov 1st, 2024 at 11.4600
![]() The intermediate-term trend has been UP since Jun 11th, 2025 at 10.9099
The intermediate-term trend has been UP since Jun 11th, 2025 at 10.9099
![]() The short-term trend has been DOWN since Jun 13th, 2025 at 10.8100
The short-term trend has been DOWN since Jun 13th, 2025 at 10.8100
Smart Scan Analysis for NEA
Based on our trend formula, NEA is rated as a -65 on a scale from -100 (Strong Downtrend) to +100 (Strong Uptrend).
| Open | High | Low | Price | Change |
|---|---|---|---|---|
| 10.870 | 10.870 | 10.800 | 10.815 | -0.082 |
| Prev. Close | Volume | Bid | Ask | Time |
| 10.820 | 795463 | 2025-06-13 15:59:31 |
| Year High | 13.8902 | Year High Date | 2018-01-03 |
| Year Low | 12.03 | Year Low Date | 2018-10-15 |
| 52wk High | 12.06 | 52wk High Date | 2024-10-01 |
| 52wk Low | 10 | 52wk Low Date | 2025-04-09 |
| Average Volume | 998,773 | Shares Outstanding | 18,507 |
| Market Cap | 3,772M | Assets | 627,668,888M |
| Liabilities | 98,753,586M | P/E Ratio | 5.7435 |
| Volatility | 6.47 |