Stock Trend Analysis Report
Prepared for you on Tuesday, May 27, 2025.
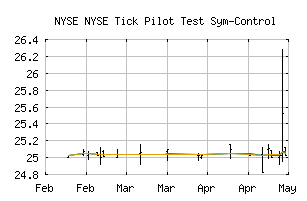
NYSE Tick Pilot Test Sym-Control (NYSE:NTEST)
Strong Downtrend (-100) - NTEST is in a strong downtrend that is likely to continue. With short-term, intermediate, and long-term bearish momentum, NTEST continues to fall. Traders should use caution and set stops.
Is it time to buy, sell, or avoid NTEST?
MarketClub looks at technical strength and momentum to determine if the timing is right for NTEST.
Learn more about the Trade Triangles and how we make technical analysis as easy as buy and sell.
|
|||||||||||||||
|
|||||||||||||||
MarketClub’s Trade Triangles for NTEST
![]() The long-term trend has been DOWN since Apr 1st, 2025 at 24.9900
The long-term trend has been DOWN since Apr 1st, 2025 at 24.9900
![]() The intermediate-term trend has been DOWN since May 23rd, 2025 at 24.5023
The intermediate-term trend has been DOWN since May 23rd, 2025 at 24.5023
![]() The short-term trend has been DOWN since May 23rd, 2025 at 24.5023
The short-term trend has been DOWN since May 23rd, 2025 at 24.5023
Smart Scan Analysis for NTEST
Based on our trend formula, NTEST is rated as a -100 on a scale from -100 (Strong Downtrend) to +100 (Strong Uptrend).
| Open | High | Low | Price | Change |
|---|---|---|---|---|
| 25.040000 | 25.482940 | 24.555450 | 25.081526 | +0.066176 |
| Prev. Close | Volume | Bid | Ask | Time |
| 25.015350 | 82465 | 2025-05-27 14:45:39 |