Stock Trend Analysis Report
Prepared for you on Tuesday, October 22, 2024.
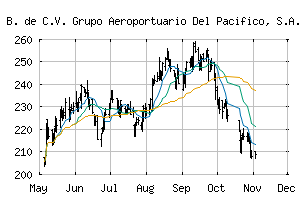
Grupo Aeroportuario Del Pacifico, S.A. B. de C.V. Grupo Aeroportuario Del Pacifico, S.A. de C.V. (each representing 10 Series B shares) (NYSE:PAC)
Crossroads (+60) - PAC is struggling to move into a solid trend. Beware of choppy markets and consider a sidelines position until a stronger trend is identified.
Is it time to buy, sell, or avoid PAC?
MarketClub looks at technical strength and momentum to determine if the timing is right for PAC.
Learn more about the Trade Triangles and how we make technical analysis as easy as buy and sell.
|
|||||||||||||||
|
|||||||||||||||
MarketClub’s Trade Triangles for PAC
![]() The long-term trend has been UP since Sep 23rd, 2024 at 185.8000
The long-term trend has been UP since Sep 23rd, 2024 at 185.8000
![]() The intermediate-term trend has been DOWN since Oct 3rd, 2024 at 166.7575
The intermediate-term trend has been DOWN since Oct 3rd, 2024 at 166.7575
![]() The short-term trend has been DOWN since Oct 22nd, 2024 at 171.4000
The short-term trend has been DOWN since Oct 22nd, 2024 at 171.4000
Smart Scan Analysis for PAC
Based on our trend formula, PAC is rated as a +60 on a scale from -100 (Strong Downtrend) to +100 (Strong Uptrend).
| Open | High | Low | Price | Change |
|---|---|---|---|---|
| 174.49 | 175.38 | 169.40 | 174.40 | 0.00 |
| Prev. Close | Volume | Bid | Ask | Time |
| 174.40 | 191719 | 2024-10-22 15:57:16 |
| Year High | 111.6 | Year High Date | 2018-04-18 |
| Year Low | 64.45 | Year Low Date | 2018-11-26 |
| 52wk High | 197.31 | 52wk High Date | 2024-05-20 |
| 52wk Low | 107.25 | 52wk Low Date | 2023-10-27 |
| Year End Close | 57.17 | Average Volume | 93,352 |
| Shares Outstanding | 414,652 | Short Interest | 170,053 |
| % Institutional | 8.5 | Market Cap | 5,351M |
| Assets | 733,177,150M | Liabilities | 556,086,760M |
| P/E Ratio | 275.0088 | Beta | 1.23 |
| Volatility | 50.18 |