Stock Trend Analysis Report
Prepared for you on Tuesday, October 22, 2024.
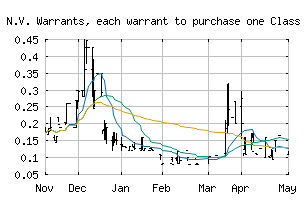
Wallbox N.V. Warrants, each warrant to purchase one Class A Ordinary Share (NYSE:WBX.WS)
Countertrend Down (-85) - WBX.WS is showing short-term strength. However, look for the longer-term bearish trend to resume. As always, continue to monitor the trend score and set stops.
Is it time to buy, sell, or avoid WBX.WS?
MarketClub looks at technical strength and momentum to determine if the timing is right for WBX.WS.
Learn more about the Trade Triangles and how we make technical analysis as easy as buy and sell.
|
|||||||||||||||
|
|||||||||||||||
MarketClub’s Trade Triangles for WBX.WS
![]() The long-term trend has been DOWN since Oct 18th, 2023 at 0.373700
The long-term trend has been DOWN since Oct 18th, 2023 at 0.373700
![]() The intermediate-term trend has been DOWN since Sep 24th, 2024 at 0.090000
The intermediate-term trend has been DOWN since Sep 24th, 2024 at 0.090000
![]() The short-term trend has been UP since Oct 3rd, 2024 at 0.073751
The short-term trend has been UP since Oct 3rd, 2024 at 0.073751
Smart Scan Analysis for WBX.WS
Based on our trend formula, WBX.WS is rated as a -85 on a scale from -100 (Strong Downtrend) to +100 (Strong Uptrend).
| Open | High | Low | Price | Change |
|---|---|---|---|---|
| 0.080000 | 0.080000 | 0.080000 | 0.080000 | -0.009899 |
| Prev. Close | Volume | Bid | Ask | Time |
| 0.080000 | 678 | 2024-10-21 15:53:12 |
| 52wk High | 0.45 | 52wk High Date | 2023-12-07 |
| 52wk Low | 0.0525 | 52wk Low Date | 2024-09-30 |
| Average Volume | 1,725 |