Stock Trend Analysis Report
Prepared for you on Monday, July 7, 2025.
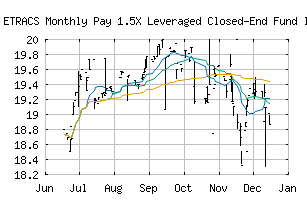
ETRACS Monthly Pay 1.5X Leveraged Closed-End Fund Index ETN (PACF:CEFD)
Countertrend Up (+85) - CEFD is showing short-term weakness. However, look for the longer-term bullish trend to resume. As always, continue to monitor the trend score and utilize a stop order.
Is it time to buy, sell, or avoid CEFD?
MarketClub looks at technical strength and momentum to determine if the timing is right for CEFD.
Learn more about the Trade Triangles and how we make technical analysis as easy as buy and sell.
|
|||||||||||||||
|
|||||||||||||||
MarketClub’s Trade Triangles for CEFD
![]() The long-term trend has been UP since Jul 3rd, 2025 at 19.5788
The long-term trend has been UP since Jul 3rd, 2025 at 19.5788
![]() The intermediate-term trend has been UP since Jun 27th, 2025 at 19.2500
The intermediate-term trend has been UP since Jun 27th, 2025 at 19.2500
![]() The short-term trend has been UP since Jun 26th, 2025 at 18.6990
The short-term trend has been UP since Jun 26th, 2025 at 18.6990
Smart Scan Analysis for CEFD
Based on our trend formula, CEFD is rated as a +80 on a scale from -100 (Strong Downtrend) to +100 (Strong Uptrend).
| Open | High | Low | Price | Change |
|---|---|---|---|---|
| 19.5000 | 19.6000 | 19.6000 | 19.6000 | +0.0966 |
| Prev. Close | Volume | Bid | Ask | Time |
| 19.5577 | 1418 | 2025-07-03 11:28:55 |
| 52wk High | 21.2 | 52wk High Date | 2024-12-11 |
| 52wk Low | 14.935 | 52wk Low Date | 2025-04-21 |
| Average Volume | 1,788 |