Stock Trend Analysis Report
Prepared for you on Wednesday, September 10, 2025.
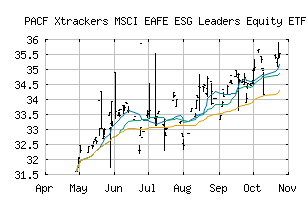
Xtrackers MSCI EAFE ESG Leaders Equity ETF (PACF:EASG)
Weak Uptrend (+65) - EASG is showing signs of weakening momentum to the upside. Monitor EASG as it may be in the beginning stages of a reversal.
Is it time to buy, sell, or avoid EASG?
MarketClub looks at technical strength and momentum to determine if the timing is right for EASG.
Learn more about the Trade Triangles and how we make technical analysis as easy as buy and sell.
|
|||||||||||||||
|
|||||||||||||||
MarketClub’s Trade Triangles for EASG
![]() The long-term trend has been UP since Apr 30th, 2025 at 31.925
The long-term trend has been UP since Apr 30th, 2025 at 31.925
![]() The intermediate-term trend has been DOWN since Sep 2nd, 2025 at 33.440
The intermediate-term trend has been DOWN since Sep 2nd, 2025 at 33.440
![]() The short-term trend has been UP since Sep 5th, 2025 at 34.040
The short-term trend has been UP since Sep 5th, 2025 at 34.040
Smart Scan Analysis for EASG
Based on our trend formula, EASG is rated as a +65 on a scale from -100 (Strong Downtrend) to +100 (Strong Uptrend).
| Open | High | Low | Price | Change |
|---|---|---|---|---|
| 34.1700 | 34.4700 | 34.1700 | 34.4300 | +0.3075 |
| Prev. Close | Volume | Bid | Ask | Time |
| 34.3753 | 3730 | 2025-09-08 15:59:29 |
| Year High | 24.1 | Year High Date | 2018-11-08 |
| Year Low | 23.52 | Year Low Date | 2018-11-15 |
| 52wk High | 35.54 | 52wk High Date | 2025-07-07 |
| 52wk Low | 27.27 | 52wk Low Date | 2025-04-07 |
| Average Volume | 2,790 |