Stock Trend Analysis Report
Prepared for you on Friday, May 9, 2025.
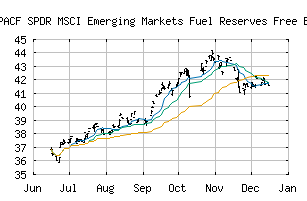
SPDR MSCI Emerging Markets Fuel Reserves Free ETF (PACF:EEMX)
Countertrend Up (+85) - EEMX is showing short-term weakness. However, look for the longer-term bullish trend to resume. As always, continue to monitor the trend score and utilize a stop order.
Is it time to buy, sell, or avoid EEMX?
MarketClub looks at technical strength and momentum to determine if the timing is right for EEMX.
Learn more about the Trade Triangles and how we make technical analysis as easy as buy and sell.
|
|||||||||||||||
|
|||||||||||||||
MarketClub’s Trade Triangles for EEMX
![]() The long-term trend has been UP since May 5th, 2025 at 35.0300
The long-term trend has been UP since May 5th, 2025 at 35.0300
![]() The intermediate-term trend has been UP since Apr 29th, 2025 at 33.6765
The intermediate-term trend has been UP since Apr 29th, 2025 at 33.6765
![]() The short-term trend has been DOWN since May 7th, 2025 at 34.6400
The short-term trend has been DOWN since May 7th, 2025 at 34.6400
Smart Scan Analysis for EEMX
Based on our trend formula, EEMX is rated as a +85 on a scale from -100 (Strong Downtrend) to +100 (Strong Uptrend).
| Open | High | Low | Price | Change |
|---|---|---|---|---|
| 34.63 | 34.70 | 34.58 | 34.63 | +0.07 |
| Prev. Close | Volume | Bid | Ask | Time |
| 34.56 | 4647 | 2025-05-08 15:42:38 |
| Year High | 76.8 | Year High Date | 2018-01-26 |
| Year Low | 55.74 | Year Low Date | 2018-10-30 |
| 52wk High | 36.56 | 52wk High Date | 2024-10-07 |
| 52wk Low | 29.35 | 52wk Low Date | 2025-04-07 |
| Average Volume | 7,903 | Volatility | 29.79 |