Stock Trend Analysis Report
Prepared for you on Wednesday, April 8, 2026.
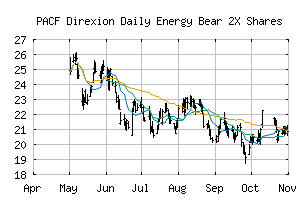
Direxion Daily Energy Bear 2X Shares (PACF:ERY)
Countertrend Down (-85) - ERY is showing short-term strength. However, look for the longer-term bearish trend to resume. As always, continue to monitor the trend score and set stops.
Is it time to buy, sell, or avoid ERY?
MarketClub looks at technical strength and momentum to determine if the timing is right for ERY.
Learn more about the Trade Triangles and how we make technical analysis as easy as buy and sell.
|
|||||||||||||||
|
|||||||||||||||
MarketClub’s Trade Triangles for ERY
![]() The long-term trend has been DOWN since Aug 28th, 2025 at 20.490
The long-term trend has been DOWN since Aug 28th, 2025 at 20.490
![]() The intermediate-term trend has been DOWN since Jan 2nd, 2026 at 18.982
The intermediate-term trend has been DOWN since Jan 2nd, 2026 at 18.982
![]() The short-term trend has been UP since Mar 31st, 2026 at 10.500
The short-term trend has been UP since Mar 31st, 2026 at 10.500
Smart Scan Analysis for ERY
Based on our trend formula, ERY is rated as a -85 on a scale from -100 (Strong Downtrend) to +100 (Strong Uptrend).
| Open | High | Low | Price | Change |
|---|---|---|---|---|
| 10.730 | 10.755 | 10.405 | 10.620 | -0.180 |
| Prev. Close | Volume | Bid | Ask | Time |
| 10.630 | 10948654 | 2026-04-07 15:59:53 |
| Year High | 60.45 | Year High Date | 2018-02-09 |
| Year Low | 29.0799 | Year Low Date | 2018-10-09 |
| 52wk High | 31.02 | 52wk High Date | 2025-04-09 |
| 52wk Low | 9.57 | 52wk Low Date | 2026-03-30 |
| Year End Close | 7.82 | Average Volume | 5,123,346 |
| Shares Outstanding | 254 | Assets | 824M |
| Beta | -3.62000000 | Volatility | 81.5 |