Stock Trend Analysis Report
Prepared for you on Tuesday, February 4, 2025.
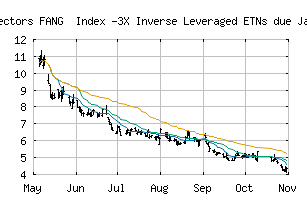
MicroSectors FANG Index -3X Inverse Leveraged ETNs due January 8, 2038 (PACF:FNGD)
Countertrend Down (-85) - FNGD is showing short-term strength. However, look for the longer-term bearish trend to resume. As always, continue to monitor the trend score and set stops.
Is it time to buy, sell, or avoid FNGD?
MarketClub looks at technical strength and momentum to determine if the timing is right for FNGD.
Learn more about the Trade Triangles and how we make technical analysis as easy as buy and sell.
|
|||||||||||||||
|
|||||||||||||||
MarketClub’s Trade Triangles for FNGD
![]() The long-term trend has been DOWN since Jul 1st, 2024 at 23.2111
The long-term trend has been DOWN since Jul 1st, 2024 at 23.2111
![]() The intermediate-term trend has been DOWN since Jan 22nd, 2025 at 12.1100
The intermediate-term trend has been DOWN since Jan 22nd, 2025 at 12.1100
![]() The short-term trend has been UP since Jan 27th, 2025 at 11.9000
The short-term trend has been UP since Jan 27th, 2025 at 11.9000
Smart Scan Analysis for FNGD
Based on our trend formula, FNGD is rated as a -85 on a scale from -100 (Strong Downtrend) to +100 (Strong Uptrend).
| Open | High | Low | Price | Change |
|---|---|---|---|---|
| 12.2400 | 12.2900 | 11.8300 | 11.8501 | -0.5499 |
| Prev. Close | Volume | Bid | Ask | Time |
| 12.4000 | 2708194 | 2025-02-04 15:59:42 |
| Year High | 57.77 | Year High Date | 2018-02-06 |
| Year Low | 21.35 | Year Low Date | 2018-06-21 |
| 52wk High | 46.07 | 52wk High Date | 2024-04-22 |
| 52wk Low | 11.15 | 52wk Low Date | 2025-01-24 |
| Average Volume | 5,922,904 | Assets | 140,964,700M |
| Liabilities | 132,539,700M | Volatility | 125.65 |