Stock Trend Analysis Report
Prepared for you on Wednesday, March 12, 2025.
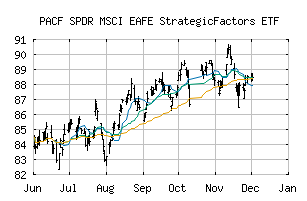
SPDR MSCI EAFE StrategicFactors ETF (PACF:QEFA)
Countertrend Up (+85) - QEFA is showing short-term weakness. However, look for the longer-term bullish trend to resume. As always, continue to monitor the trend score and utilize a stop order.
Is it time to buy, sell, or avoid QEFA?
MarketClub looks at technical strength and momentum to determine if the timing is right for QEFA.
Learn more about the Trade Triangles and how we make technical analysis as easy as buy and sell.
|
|||||||||||||||
|
|||||||||||||||
MarketClub’s Trade Triangles for QEFA
![]() The long-term trend has been UP since Feb 13th, 2025 at 77.5980
The long-term trend has been UP since Feb 13th, 2025 at 77.5980
![]() The intermediate-term trend has been UP since Jan 17th, 2025 at 73.7856
The intermediate-term trend has been UP since Jan 17th, 2025 at 73.7856
![]() The short-term trend has been DOWN since Mar 10th, 2025 at 80.0200
The short-term trend has been DOWN since Mar 10th, 2025 at 80.0200
Smart Scan Analysis for QEFA
Based on our trend formula, QEFA is rated as a +85 on a scale from -100 (Strong Downtrend) to +100 (Strong Uptrend).
| Open | High | Low | Price | Change |
|---|---|---|---|---|
| 79.8800 | 80.0133 | 78.9500 | 79.6800 | -0.0600 |
| Prev. Close | Volume | Bid | Ask | Time |
| 79.4400 | 33227 | 2025-03-11 15:47:29 |
| Year High | 68.94 | Year High Date | 2018-01-26 |
| Year Low | 57.81 | Year Low Date | 2018-10-26 |
| 52wk High | 81.49 | 52wk High Date | 2024-09-26 |
| 52wk Low | 71.42 | 52wk Low Date | 2024-12-20 |
| Average Volume | 81,021 | Volatility | 14.91 |