Stock Trend Analysis Report
Prepared for you on Wednesday, July 2, 2025.
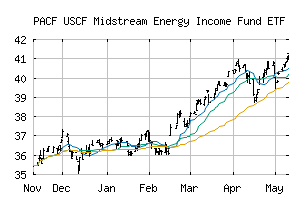
USCF Midstream Energy Income Fund ETF (PACF:UMI)
Weak Downtrend (-65) - UMI is showing signs of a strengthening downtrend. Monitor UMI as it may be building momentum to the downside.
Is it time to buy, sell, or avoid UMI?
MarketClub looks at technical strength and momentum to determine if the timing is right for UMI.
Learn more about the Trade Triangles and how we make technical analysis as easy as buy and sell.
|
|||||||||||||||
|
|||||||||||||||
MarketClub’s Trade Triangles for UMI
![]() The long-term trend has been DOWN since Apr 4th, 2025 at 48.2201
The long-term trend has been DOWN since Apr 4th, 2025 at 48.2201
![]() The intermediate-term trend has been DOWN since Jul 2nd, 2025 at 49.6700
The intermediate-term trend has been DOWN since Jul 2nd, 2025 at 49.6700
![]() The short-term trend has been DOWN since Jul 1st, 2025 at 50.0800
The short-term trend has been DOWN since Jul 1st, 2025 at 50.0800
Smart Scan Analysis for UMI
Based on our trend formula, UMI is rated as a -70 on a scale from -100 (Strong Downtrend) to +100 (Strong Uptrend).
| Open | High | Low | Price | Change |
|---|---|---|---|---|
| 50.1000 | 50.4300 | 49.6450 | 50.4100 | +0.3313 |
| Prev. Close | Volume | Bid | Ask | Time |
| 50.0787 | 18189 | 2025-07-02 15:59:27 |
| 52wk High | 55.05 | 52wk High Date | 2025-01-21 |
| 52wk Low | 40.3201 | 52wk Low Date | 2024-08-05 |
| Average Volume | 20,797 |