Stock Trend Analysis Report
Prepared for you on Sunday, February 1, 2026.
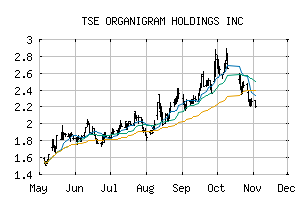
ORGANIGRAM HOLDINGS INC (TSE:OGI)
Strong Downtrend (-100) - OGI is in a strong downtrend that is likely to continue. With short-term, intermediate, and long-term bearish momentum, OGI continues to fall. Traders should use caution and set stops.
Is it time to buy, sell, or avoid OGI?
MarketClub looks at technical strength and momentum to determine if the timing is right for OGI.
Learn more about the Trade Triangles and how we make technical analysis as easy as buy and sell.
|
|||||||||||||||
|
|||||||||||||||
MarketClub’s Trade Triangles for OGI
![]() The long-term trend has been DOWN since Jan 30th, 2026 at 2.05
The long-term trend has been DOWN since Jan 30th, 2026 at 2.05
![]() The intermediate-term trend has been DOWN since Jan 15th, 2026 at 2.22
The intermediate-term trend has been DOWN since Jan 15th, 2026 at 2.22
![]() The short-term trend has been DOWN since Jan 28th, 2026 at 2.19
The short-term trend has been DOWN since Jan 28th, 2026 at 2.19
Smart Scan Analysis for OGI
Based on our trend formula, OGI is rated as a -100 on a scale from -100 (Strong Downtrend) to +100 (Strong Uptrend).
| Open | High | Low | Price | Change |
|---|---|---|---|---|
| 2.12 | 2.16 | 2.03 | 2.03 | -0.10 |
| Prev. Close | Volume | Bid | Ask | Time |
| 2.03 | 290257 | 2026-01-30 16:00:02 |