Index Trend Analysis Report
Prepared for you on Sunday, November 2, 2025.
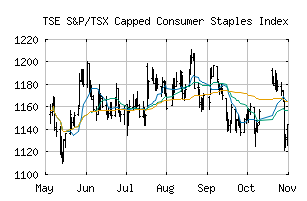
S&P/TSX Capped Consumer Staples Index (TSE:TTCS)
Long-Term Downtrend (-90) - TTCS is in a strong downtrend that is likely to continue. While TTCS is showing intraday strength, it remains in the confines of a bearish trend. Traders should use caution and set stops.
Is it time to buy, sell, or avoid TTCS?
MarketClub looks at technical strength and momentum to determine if the timing is right for TTCS.
Learn more about the Trade Triangles and how we make technical analysis as easy as buy and sell.
|
|||||||||||||||
|
|||||||||||||||
MarketClub’s Trade Triangles for TTCS
![]() The long-term trend has been DOWN since Sep 26th, 2025 at 1134.65
The long-term trend has been DOWN since Sep 26th, 2025 at 1134.65
![]() The intermediate-term trend has been DOWN since Oct 29th, 2025 at 1124.95
The intermediate-term trend has been DOWN since Oct 29th, 2025 at 1124.95
![]() The short-term trend has been DOWN since Oct 23rd, 2025 at 1175.37
The short-term trend has been DOWN since Oct 23rd, 2025 at 1175.37
Smart Scan Analysis for TTCS
Based on our trend formula, TTCS is rated as a -90 on a scale from -100 (Strong Downtrend) to +100 (Strong Uptrend).
| Open | High | Low | Price | Change |
|---|---|---|---|---|
| 1131.52 | 1144.36 | 1126.05 | 1144.22 | +11.66 |
| Prev. Close | Volume | Bid | Ask | Time |
| 1144.31 | 2824345 | 2025-10-31 15:59:46 |
| 52wk High | 567.53 | 52wk High Date | 2018-07-16 |
| 52wk Low | 496.79 | 52wk Low Date | 2018-11-02 |