Index Trend Analysis Report
Prepared for you on Tuesday, March 31, 2026.
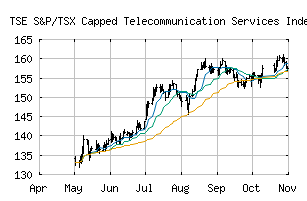
S&P/TSX Capped Telecommunication Services Index (TSE:TTTS)
Weak Uptrend (+65) - TTTS is showing signs of weakening momentum to the upside. Monitor TTTS as it may be in the beginning stages of a reversal.
Is it time to buy, sell, or avoid TTTS?
MarketClub looks at technical strength and momentum to determine if the timing is right for TTTS.
Learn more about the Trade Triangles and how we make technical analysis as easy as buy and sell.
|
|||||||||||||||
|
|||||||||||||||
MarketClub’s Trade Triangles for TTTS
![]() The long-term trend has been UP since Feb 4th, 2026 at 162.80
The long-term trend has been UP since Feb 4th, 2026 at 162.80
![]() The intermediate-term trend has been UP since Jan 2nd, 2026 at 157.58
The intermediate-term trend has been UP since Jan 2nd, 2026 at 157.58
![]() The short-term trend has been DOWN since Mar 27th, 2026 at 165.76
The short-term trend has been DOWN since Mar 27th, 2026 at 165.76
Smart Scan Analysis for TTTS
Based on our trend formula, TTTS is rated as a +65 on a scale from -100 (Strong Downtrend) to +100 (Strong Uptrend).
| Open | High | Low | Price | Change |
|---|---|---|---|---|
| 165.10 | 166.40 | 164.43 | 165.52 | +0.42 |
| Prev. Close | Volume | Bid | Ask | Time |
| 165.10 | 12732864 | 2026-03-31 16:00:01 |
| 52wk High | 175.59 | 52wk High Date | 2017-11-30 |
| 52wk Low | 153.22 | 52wk Low Date | 2018-04-04 |