Stock Trend Analysis Report
Prepared for you on Wednesday, February 5, 2025.
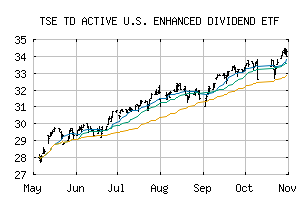
TD ACTIVE U.S. ENHANCED DIVIDEND ETF (TSE:TUED)
Weak Uptrend (+65) - TUED is showing signs of weakening momentum to the upside. Monitor TUED as it may be in the beginning stages of a reversal.
Is it time to buy, sell, or avoid TUED?
MarketClub looks at technical strength and momentum to determine if the timing is right for TUED.
Learn more about the Trade Triangles and how we make technical analysis as easy as buy and sell.
|
|||||||||||||||
|
|||||||||||||||
MarketClub’s Trade Triangles for TUED
![]() The long-term trend has been UP since Aug 17th, 2022 at 19.13
The long-term trend has been UP since Aug 17th, 2022 at 19.13
![]() The intermediate-term trend has been UP since Jan 17th, 2025 at 31.86
The intermediate-term trend has been UP since Jan 17th, 2025 at 31.86
![]() The short-term trend has been DOWN since Feb 3rd, 2025 at 31.40
The short-term trend has been DOWN since Feb 3rd, 2025 at 31.40
Smart Scan Analysis for TUED
Based on our trend formula, TUED is rated as a +65 on a scale from -100 (Strong Downtrend) to +100 (Strong Uptrend).
| Open | High | Low | Price | Change |
|---|---|---|---|---|
| 31.56 | 31.56 | 31.32 | 31.40 | -0.31 |
| Prev. Close | Volume | Bid | Ask | Time |
| 31.38 | 59842 | 2025-02-04 15:59:30 |