Stock Trend Analysis Report
Prepared for you on Wednesday, March 18, 2026.
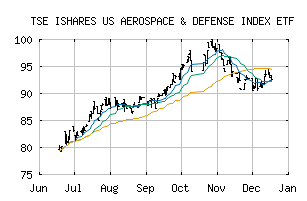
ISHARES US AEROSPACE & DEFENSE INDEX ETF (TSE:XAD)
Crossroads (-60) - XAD is struggling to move into a solid trend. Beware of choppy markets and consider a sidelines position until a stronger trend is identified.
Is it time to buy, sell, or avoid XAD?
MarketClub looks at technical strength and momentum to determine if the timing is right for XAD.
Learn more about the Trade Triangles and how we make technical analysis as easy as buy and sell.
|
|||||||||||||||
|
|||||||||||||||
MarketClub’s Trade Triangles for XAD
![]() The long-term trend has been UP since May 12th, 2025 at 74.29
The long-term trend has been UP since May 12th, 2025 at 74.29
![]() The intermediate-term trend has been DOWN since Mar 12th, 2026 at 103.56
The intermediate-term trend has been DOWN since Mar 12th, 2026 at 103.56
![]() The short-term trend has been DOWN since Mar 5th, 2026 at 107.34
The short-term trend has been DOWN since Mar 5th, 2026 at 107.34
Smart Scan Analysis for XAD
Based on our trend formula, XAD is rated as a -60 on a scale from -100 (Strong Downtrend) to +100 (Strong Uptrend).
| Open | High | Low | Price | Change |
|---|---|---|---|---|
| 103.17 | 103.33 | 102.46 | 103.25 | +0.09 |
| Prev. Close | Volume | Bid | Ask | Time |
| 103.25 | 3312 | 2026-03-17 15:58:55 |