
Stocks are coming off a volatile February. After reaching an all-time high of 29,568.57 on February 12, 2020, the Dow Jones Industrial Index (DJI) shed almost 5,000 points in a historic, multi-day drop.
The global impact of the coronavirus sent panic down Wall Street. Stocks in the travel, hotel, and the food sector suffered – Carnival Corporation (CCL) dropped more than 30% in 11 trading days, while Yum! Brands, Inc. (YUM) dipped about 16% in the same time period. Conversely, tech teleconferencing stocks and biotech stocks managed to hold their ground. Zoom Video Communications (ZM) jumped approximately 37% between February 12 and February 23.
It is hard to say how investors will react to a domestic coronavirus spread. Even if we see more quadruple-digit drops for the major indexes, there will always be trading opportunities if you know where to look.
Our scanning tools continuously pick through thousands of stocks to identify bullish charting patterns and price action with technical momentum. Check out the Trade Triangles issued for these strong stocks and their long-term outlook.
Better yet, join MarketClub now and see the entry and exit signals as they are triggered. You’ll also get access to our daily trade ideas, alerts, charts, and customizable portfolio manager.
Start Your 30-day MarketClub Trial Now
Hottest Stocks for March 2020
Karyopharm Therapeutics, Inc. (KPTI)
This pharmaceutical company, headquartered in Newton, MA, focuses on cancer treatments.
Avg. Volume: 1,207,688
Market Cap: 1.88B
Monthly Green Trade Triangle: 6/21/19 at $6.43
Smart Scan Score: +100
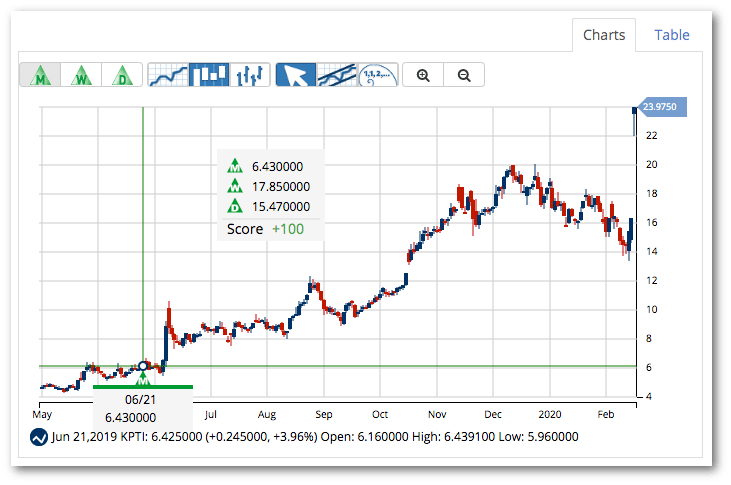
The stock is up more than 292% since MarketClub members received the last monthly Trade Triangle. KPTI is still showing a +100 Chart Analysis Score, suggesting that the momentum is still very bullish.
Cincinnati Bell, Inc. (CBB)
Together with its subsidiaries, Cincinnati Bell, Inc. provides telecommunication and technology services to both residential and business customers. The company operates in two segments – entertainment and communications and IT services and hardware.
Avg. Volume: 909,047
Market Cap: 739.75M
Monthly Green Trade Triangle: 9/10/19 at $6.83
Smart Scan Score: +100
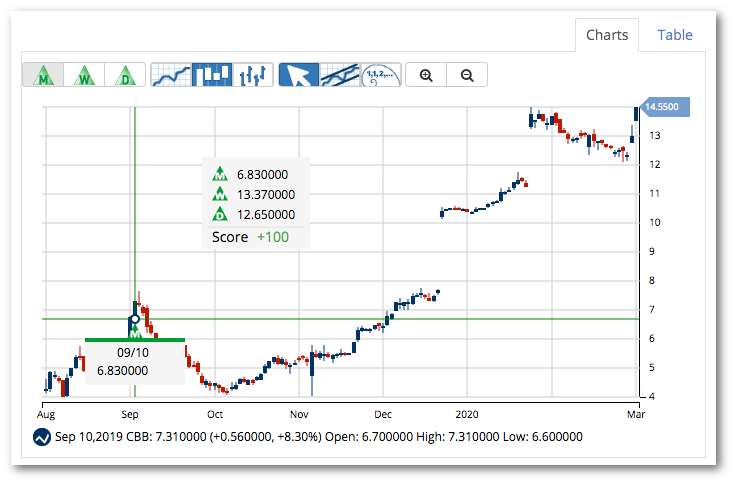
MarketClub members received a green, monthly Trade Triangle in September of 2019. While the stock pulled back, the monthly trend remained strong and members caught two huge gap ups.
Currently, CBB has more than doubled since the last long-term Trade Triangle. The trend remains strong to the upside.
Rite Aud Corp (RAD)
Rite Aid operates a chain of drug stores, selling prescription drugs as well as over-the-counter medicines and health and beauty products. The company also operates retail clinics with basic services such as screenings, immunizations, and basic physical exams.
Avg. Volume: 7,941,893
Market Cap: 800.3M
Monthly Green Trade Triangle: 11/1/19 at $9.96
Smart Scan Score: +100
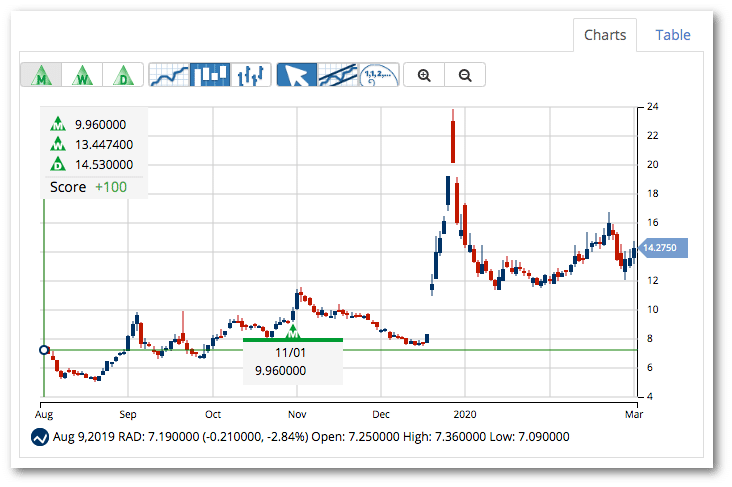
The last six months have been wild for RAD. MarketClub members caught the last monthly, green Trade Triangle on November 1, 2019, at $9.96. RAD then rallied to close to $24/share before falling back to the $12-$14 range.
The trend for Rite Aid remains strong. Not only is RAD trading 45% above the last monthly green Trade Triangle, but the Chart Analysis score sits at +100.
Health Insurance Innovations (HIIQ)
This cloud-based tech platform and distributor offers health insurance plans for individuals and families. These plans include short-term and supplemental products to cover a number of plans.
Avg. Volume: 811,160
Market Cap: 444.5M
Monthly Green Trade Triangle: 2/6/20 at $26.44
Smart Scan Score: +100
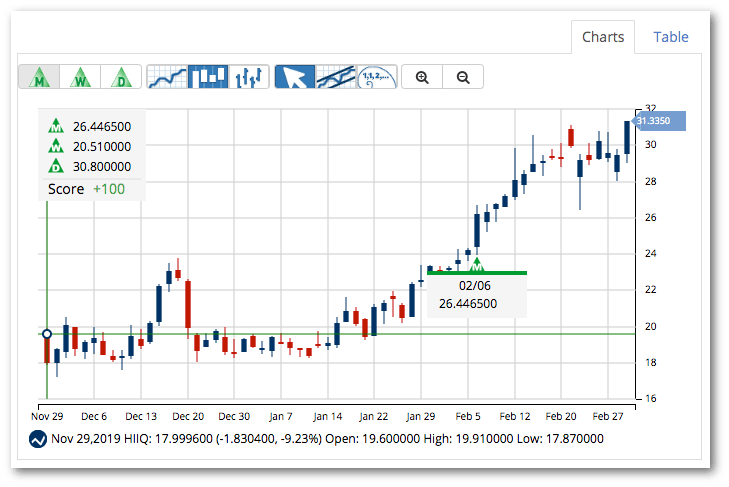
HIIQ has been on a run since MarketClub issued a green monthly Trade Triangle on February 6, 2020. Members caught an 18% move up and the Chart Analysis Score remains strong.
Heron Tech Co Ltd (HEBT)
This Chinese-based company develops, manufactures, and installs valves, pumps, and other products. In addition, Heron also services equipment for the pharmaceutical, biological and food and beverage industries.
Avg. Volume: 143,091
Market Cap: 125.9M
Monthly Green Trade Triangle: 6/20/19 at $1.66
Smart Scan Score: +100
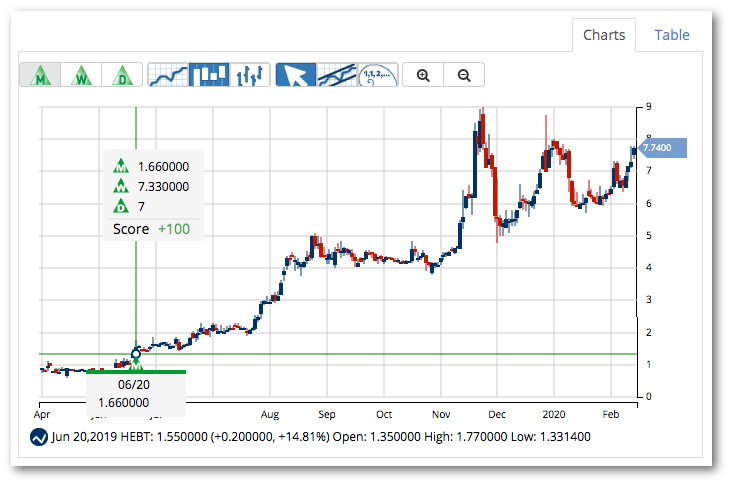
Our Trade Triangle Technology spotted long-term, bullish momentum in the summer of 2019 at $1.66. HEBT has since exploded, jumping more than 363% since members received their last monthly signal.
While some may think this ride is over, the Chart Analysis Score is showing momentum on all time frames and it looks like it still has room to the upside.
Just like news on the coronavirus, trends can change quickly. Changes in price action and crucial chart patterns may alter the outlook for these 5 stocks.
This does NOT mean you should sit in front of your computer to monitor the action for these stocks!
Let MarketClub carefully watch these stocks for you and alert you to any changes in trend.
Begin your 30-Day MarketClub trial right now to get the signals, alerts, and member-exclusive analysis for the hottest stocks, futures, ETFs, and forex pairs for March 2020.
