

The stock market was a hot mess in April, with the S&P 500 dropping almost 9% during the month, the NASDAQ crashing over 13%, and the Dow Jones Industrial Average shedding nearly 5%.
With eyes on the Fed, a COVID resurgence in Asia, continued supply chain issues, corporate profits this earnings season, and a news cycle that seems to be speeding up exponentially, it’s enough to drive you mad.
But it shouldn’t and here’s why… the only thing we need to listen to is the market. It’s telling the story, and we just have to be focused enough to read it and use it to our advantage.
Sponsor Message
The One Company on the Cusp of a Potential 20,300% Market Surge
Tesla recently announced the “One Million Mile Battery.” But a former Tesla employee has already beat them to the punch. His energy innovation is so strong, it can send a Tesla cross country without charging – FOUR TIMES. Imagine a “superbattery” that, charges in eight minutes, lasts 9,200 miles between charges, and has a lifespan of 12 MILLION miles.
This tech already exists. And it’s rolling out to manufacturers at this moment.
Right now, there are hundreds of stocks telling a bullish tale, and MarketClub makes it easy to find them.
See 5 stocks on our hotlist and sign up for a MarketClub trial to see the signals or the many other tickers with major potential for May 2022.
5 Hot Stocks for May 2022
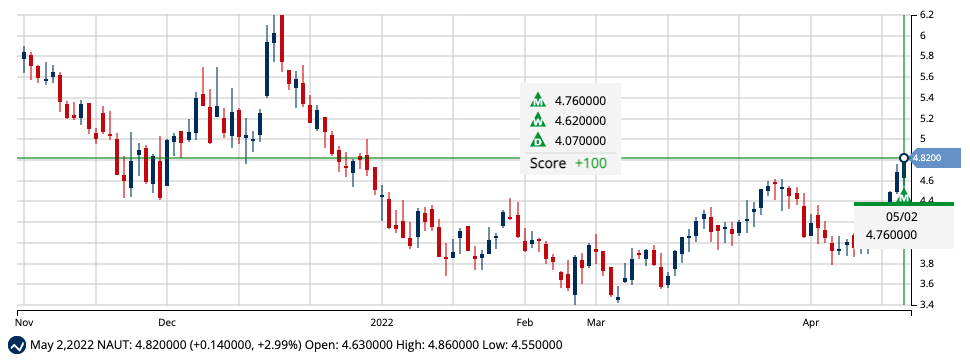
Nautilus Biotechnology, Inc. (NAUT)
This company, headquartered in Seattle, Washington, is a development stage sciences company focusing on the field of proteomics. According to Nautilus, the company aims to “revolutionize how biological research is conducted, drugs are identified and developed, and human disease is treated.”
This stock has dropped more than 31% since triggering a red monthly Trade Triangle on September 13, 2021, at $7.05/share.
However, recent price action triggered a set of new bullish signals with a new monthly Trade Triangle on May 2, 2022, and a +100 Chart Analysis Score point to a move higher for NAUT.
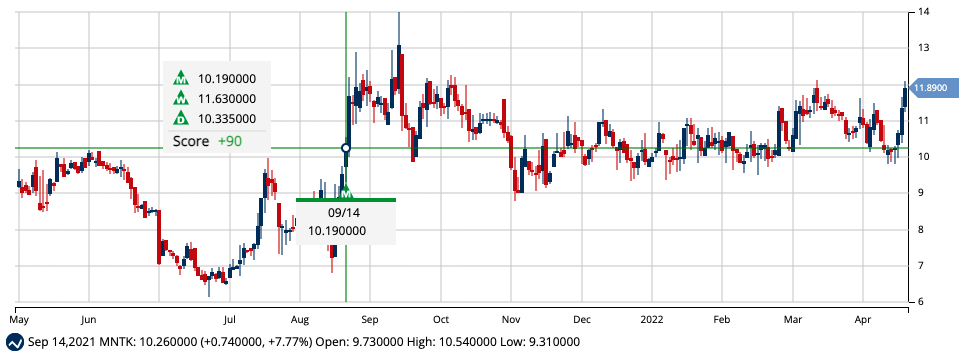
Montauk Renewables, Inc. (MNTK)
Montauk is a renewable energy company that harnesses biogas from landfills and other non-fossil fuel sources. The company’s technology captures methane before being released into the atmosphere and converts it into electrical power.
After hitting the street in early 2021, the stock fell about 50% from the all-time high made on February 17, 2021, at $14.79/share. After trading briefly below the $7/share mark, the stock began trading in a tight range between $10 and $11. The recent move above this point triggered new short-term signals aligned with the long-term trend. Based on the Chart Analysis Score and the Trade Triangle, MNTK could continue to push higher.
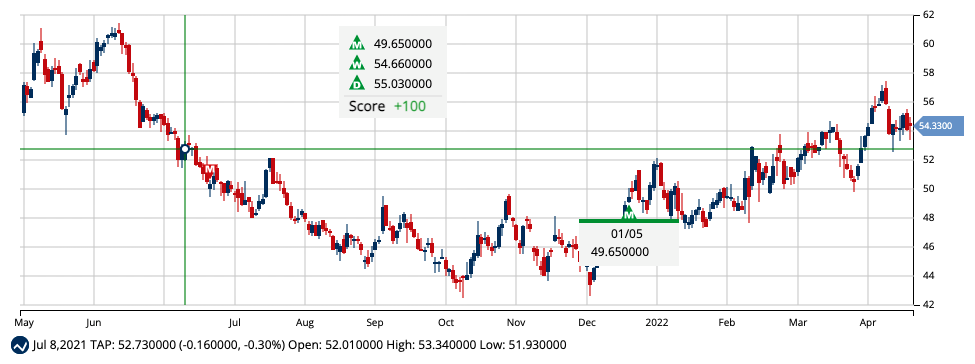
Molson Coors Beverage Company (TAP)
Molson Coors Beverage Co is a well-known, U.S.-based company that manufactures, markets, and sells beer and malt beverages across the globe. The company was founded in 1774 and currently employs more than 16K people.
TAP reached an all-time high of $111.09/share on October 13, 2016. Unfortunately, the stock didn’t stay at that level for long. Over the next four years, the stock tumbled 71%, hitting a low of $32.19 on September 25, 2020. After trading in the low $30 range, the stock began to climb.
TAP is up a little over 9% since the last monthly Trade Triangle triggered in January 2022. With a strong Chart Analysis score and short-term, intermediate, and long-term trends in alignment, TAP could continue to push into the $60/share level.
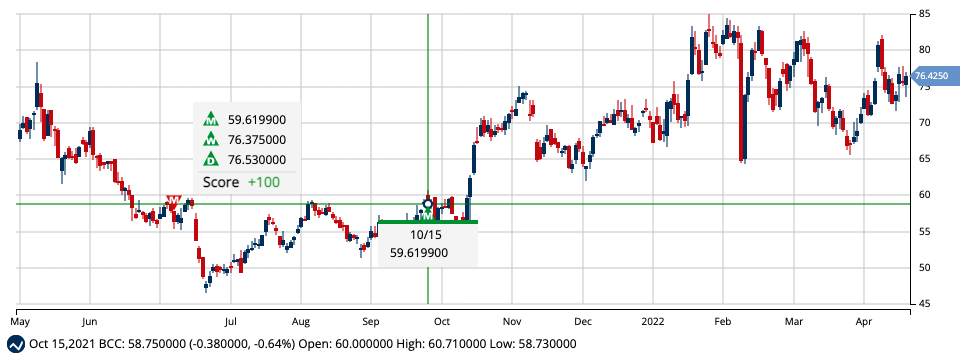
Boise Cascade Company (BCC)
Boise Cascade is a wood manufacturing company servicing customers in the U.S. and Canada. The company operates through two segments, wood products and building materials distribution.
Since March 2020, BCC’s stock price has climbed steadily, moving from $20.08 before taking a break once reaching the mid-$70s level. Price action in late 2021 triggered a long-term bullish trend signal, and the stock is still delivering, up about 30%. Green bullish signals across the board and a solid Chart Analysis Score point to a move higher for BCC.
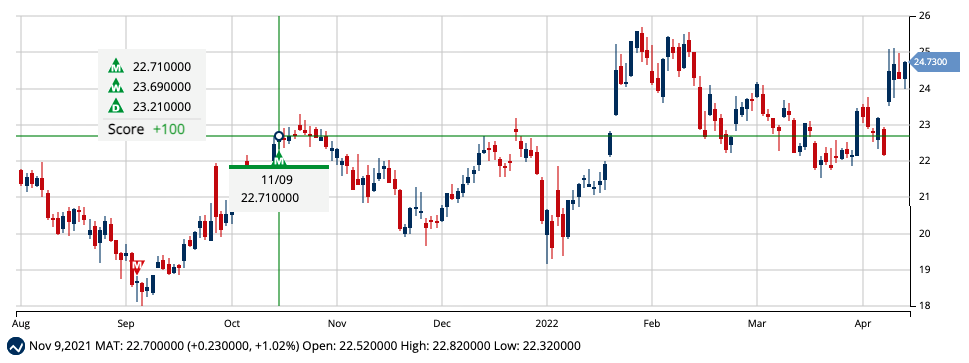
Mattel, Inc. (MAT)
Mattel, Inc., a children’s entertainment company, designs and produces toys and consumer products worldwide. The company’s brands include American Girl, Barbie, Monster High, and Polly Pocket, among many others.
2020 was a good year for Mattel, and it was one of the first steady long-term trends in multiple years. While the stock began trading sideways at the $20-$24 level at the end of last year, a new move upwards and aligning short-term and intermediate-term bullish trends point to a continued run for Mattel.
These are not the only stocks to earn a coveted +90 or +100 Chart Analysis Score since the first trading day of May.
Start your MarketClub trial now to see all of the stocks with a strong chart analysis score and the entry and exit signals for these stocks and thousands of others.
You’ll also get access to our daily trade ideas, alerts, charts, and customizable portfolio manager.
Data as of the close on 5/2/22.