
Quickly find winning trades in any market.
MarketClub’s Smart Scan will help you quickly find winning trades in all the markets we cover. Our technology scans the market and highlights solid trades that match your trading style and preferences.
Since every trader is different, we provide scans for 24 different charting patterns. This allows traders to choose trend directions or trending strengths that best fit their style. Once you select your scan type, you then use our filtering tools to narrow down your results to your preferred volume, price, and exchange.
What does Smart Scan look for?
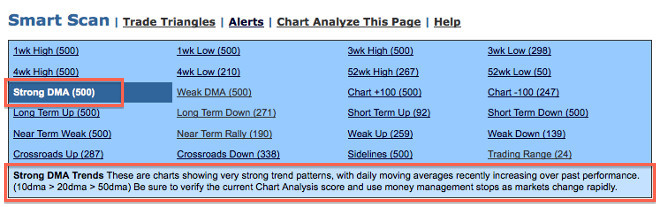
Smart Scan allows you to choose from 24 different scans. Once selected, each scan will display a description of what it is searching for in the bottom of the blue box, in the lighter shaded area. Many of the scans are based on the technology that drives our Chart Analysis Score.
For a more detailed description of each scan type, please see this page.

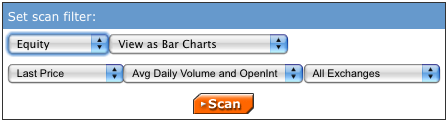
How do I filter the SmartScan results?
Once you choose the type of scan, you can then set the parameters of the markets that are returned. You can filter by security type, price, and volume, as well as separate US, Canadian, and Australian exchanges. Then you can set how you would like the results to be displayed, whether charts or a list.
What is the Chart Analysis Score?
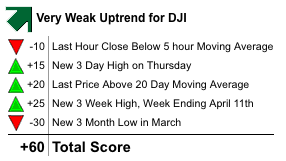
MarketClub’s Chart Analysis Score is a proprietary tool that measures trend strength and direction based on five different timing thresholds. This tool takes into account intraday price action, new daily, weekly and monthly highs and lows, and moving averages. This Score will dynamically update depending upon intraday price action and as new highs or lows occur.
The Chart Analysis Score can be used in conjunction with our Trade Triangle signals to help you determine prime trading opportunities. The Scores can generally be viewed like this:
+/-50 to 65: Trading Range
+/-70 to 80: Emerging Trend
+/-85 to 100: Strong Trend
While the Chart Analysis Scores can be generalized by a strong trend, emerging trend, or trading range, each score also offers its own detailed description.
+100: Strong uptrend is in place and this market will likely remain in a long-term positive direction.
+90: This score suggests this market will continue positive longer term. Look for this market to remain firm in a strong uptrend and use money management stops.
+85: An uptrend is in place. Intraday, weekly, and monthly trends are pointing in a positive direction, while the daily trend is in a downward direction.
+80: An uptrend is in place. Although the intraday, daily, weekly, and monthly trends are all pointing in a positive direction, the current market action has fallen below the 20-day moving average.
+75: The market may be in some near-term weakness. This market is still in a long-term upward trend with weekly and monthly trends pointing to a bull market, but daily and intraday trends pointing to bearish movement. Keep tight money management stops.
+70: This market may be experiencing some near-term weakness. However, this market remains in the confines of a longer-term uptrend.
+65: Although the long-term positive trend is strengthening, the intermediate-term could signal the start of a major downtrend. You may want to keep your money management stops tighter than you normally would. You may also want to incorporate an alternative technical analysis study on your short-term chart to confirm the Trade Triangle signals.
+60: This upward trend may have lost momentum and may be reaching a crossroads. You may see choppy market conditions in the near-term. Trends for the intraday, short-term, intermediate-term, and long-term are not aligning in a stable direction. This would be a time to move onto the sidelines until a steady trend returns.
+55: The trend of this market is in a trading range. Trends for the intraday, short-term, intermediate-term, and long-term are not aligning in a stable direction. This may be the time to move onto the sidelines until a steady trend returns.
+/-50: The trend is at a crossroads and the momentum is faint, if even there at all. Look for near-term choppy trading conditions and consider taking a sidelines position until a steady trend returns.
-55: The trend of this market is in a trading range. Trends for the intraday, short-term, intermediate-term, and long-term are not aligning in a stable direction. This would be the time to move onto the sidelines until a steady trend returns.
-60: The downtrend has lost momentum and is reaching a crossroads. You may see choppy market conditions in the near-term. Trends for the intraday, short-term, intermediate-term, and long-term are not aligning in a stable direction. This would be a time to move onto the sidelines until a steady trend returns.
-65: Although the long-term negative trend is strengthening, the intermediate-term could signal the start of a major uptrend. You may want to keep your money management stops tighter than you normally would.
-70: This market may be experiencing some near-term strength. However, this market remains in the confines of a longer-term downtrend.
-75: This market may be looking at some near-term rallying power. This market is still in a long-term downtrend with weekly and monthly trends pointing lower, but daily and intraday trends pointing to a bull market. Keep tight money management stops.
-80: A downtrend may be in place. Although the intraday, daily, weekly, and monthly trends are all pointing in a negative direction, the market action has moved over the 20-day moving average.
-85: A downtrend is in place. Intraday, weekly, and monthly trends are pointing in a negative direction, while the daily trend is in an upward direction.
-90: This score suggests this market will continue negative longer term. Look for this market to remain weak. Strong downtrend with money management stops.
-100: A strong downtrend is in place, and this market will likely remain in a long-term negative direction.