

Know exactly when to get in and out of the market!
Our complex analysis hides behind easy-to-use, easy-to-understand signals – giving you the answers to make confident investment decisions.
Instead of finding just one trend, we confirm trends for multiple time periods to put the mathematical odds in your favor that you will be on the winning side of that swing.
Our signals are not intended to catch tops and bottoms. Instead, the signals help members find the majority of a swing trend.
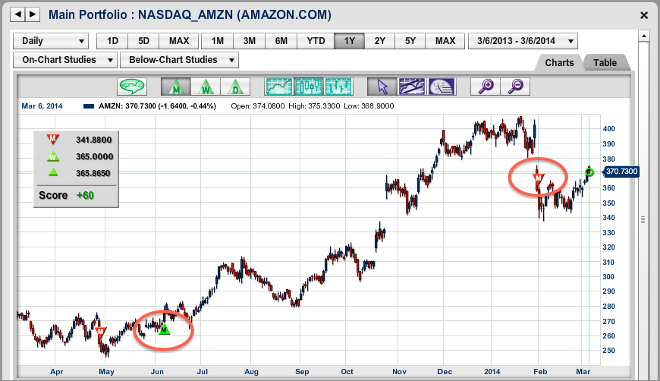
Green Triangles suggest positive trends
Red Triangles suggest negative trends
How do I use the Trade Triangles?
Below are some suggested methods for incorporating the Trade Triangles into your own trading strategy.
For LONG-TERM traders:
Generally recommended for equities, ETFs, mutual funds, and indices.
Monthly Trade Triangles determine trend and possible entry points and exit points.
The last Monthly Trade Triangle issued should be used to identify the overall trend. If the Monthly Trade Triangle is green, you can use it as a potential entry point to a long position. Then you would use the next red Monthly Trade Triangle as your potential exit point. If you were employing a “stop and reverse” type method, you could use this red Monthly Triangle as a potential entry into a short position.
You can use the Chart Analysis Score in addition to other technical analysis studies to ensure the trend strength is appropriate for trading.
For INTERMEDIATE-TERM traders:
Generally recommended for equities, ETFs, mutual funds, and indices.
Monthly Triangles determine trend and possible entry points.
Weekly Triangles determine timing exits, entries, and re-entries.
The last Monthly Triangle issued should be used to identify the overall trend. If the Weekly Triangle is green, you can use the green Monthly Triangle as a potential entry point to a long position. You would then use the next red Weekly Triangle as your potential exit point and could use the subsequent Weekly Triangles as re-entries and exits as long as the Monthly Triangle remained green.
To play the short side of the market, if your Weekly Triangle is red, you can use the red Monthly Triangle as a potential entry point to a short position. You would then use the next green Weekly Triangle as your potential exit point and could use the subsequent Weekly Triangles as re-entries and exits as long as the Monthly Triangle remained red.
You can use the Chart Analysis Score in addition to other technical analysis studies to ensure the trend strength is appropriate for trading.
For SHORT-TERM traders:
Generally recommended for futures and forex trades.
Weekly Triangles determine trend and possible entry points.
Daily Triangles determine timing exits, entries, and re-entries.
The last Weekly Triangle issued should be used to identify the overall trend. If the Daily Triangle is green, you can use the green Weekly Triangle as a potential entry point to a long position. You would then use the next red Daily Triangle as your potential exit point, and could use the subsequent Daily Triangles as re-entries and exits as long as the Weekly Triangle remained green. To play the short side of the market, if your Daily Triangle is red, you can use the red Weekly Triangle as a potential entry point to a short position. You would then use the next green Daily Triangle as your potential exit point, and could use the subsequent Daily Triangles as re-entries and exits as long as the Weekly Triangle remained red.
How do I add and remove the Trade Triangles from my charts?
Using the toolbar at the top of any large streaming chart, click any of the Trade Triangle buttons to add or remove them from your charting. The Trade Triangle button with the “M” indicates Monthly Trade Triangles, the Trade Triangle button with the “W” indicates Weekly Trade Triangles, and the Trade Triangle button with the “D” indicates Daily Trade Triangles. Be sure your charting increment is set to “Daily” or longer to view the Triangles. The Trade Triangle buttons will be greyed out and unavailable on any intra-day charting.
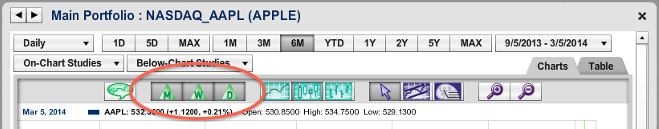
Monthly Trade Triangle – Click to add the Monthly Trade Triangles to the chart. These Triangles appear on the chart with an “M” inside.
Weekly Trade Triangle – Click to add the Weekly Trade Triangles to the chart. These Triangles appear on the chart with a “W” inside.
Daily Trade Triangle – Click to add the Daily Trade Triangles to the chart. These Triangles appear on the chart as smaller, solid Triangles.
When are the Trade Triangles issued?
The Trade Triangles are placed on the charts intra-day, as soon as our algorithm triggers on a monthly, weekly, or daily level. The date and price that triggered the algorithm will appear in the box next to the Triangle.
When I have my Trade Triangles on my charts, what do the numbers in the grey box represent?
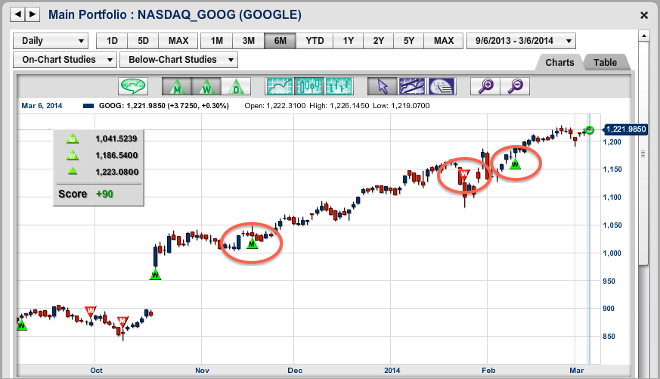
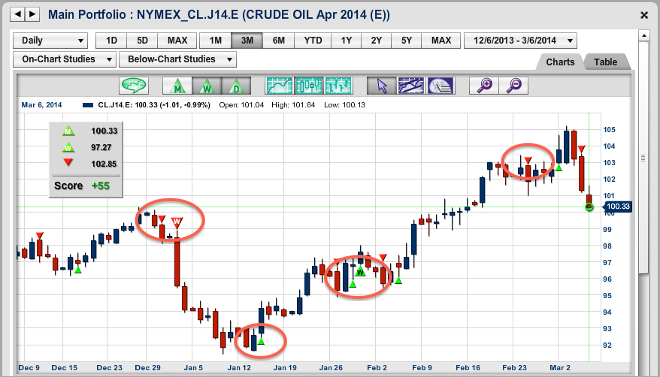
 With a quick glance, you can use the grey box to determine whether the most recent Monthly, Weekly, and Daily Trade Triangles are red or green, and see the most current Chart Analysis Score. The values listed next to each Triangle are the price points that each Triangle most recently appeared on the chart.
You can use the Chart Analysis Score page to help you determine if the Triangles in place have hit more recent highs or lows. The most current Chart Analysis Score is also shown to help you determine trend strength. You can learn more about the Chart Analysis Score.
How do I find recent Trade Triangles?
Use MarketClub’s Recent Trade Triangles scan to help you filter down the most recent Trade Triangles for the daily, weekly and monthly time periods. Use the drop downs to select security type, volume preferences, which Trade Triangle or Chart Analysis Score you would like to search for, and choose how far back you would like to scan.
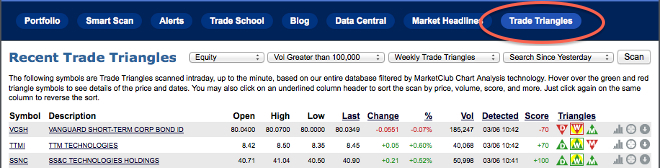
The resulting list is now inclusive of all of the parameters you select. The scan results now include a “Detected” column to show when that symbol was picked up on our radar. The “Triangles” column gives you a quick picture of what the Trade Triangles look like for each symbol. Click the column header to further sort the list.
What does the yellow box around certain Trade Triangles indicate?
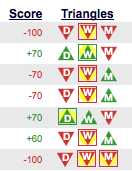 You will notice a yellow box highlighting certain Trade Triangles in your Portfolio Manager, Smart Scan, and the Trade Triangles scan results lists. This indicates a new Trade Triangle for the day.
From any of the scan results lists or your Portfolio Manager, you can then confirm the new Trade Triangle by visiting the large streaming chart.