
Relative Strength Index (RSI) is widely-used momentum oscillator measures the strength and speed of a market’s price movement by comparing the current price of the security against its past performance.
Developed by J. Welles Wilder in the 1970s, the RSI can be used to identify overbought and oversold areas, support and resistance levels, and potential entry and exit signals.
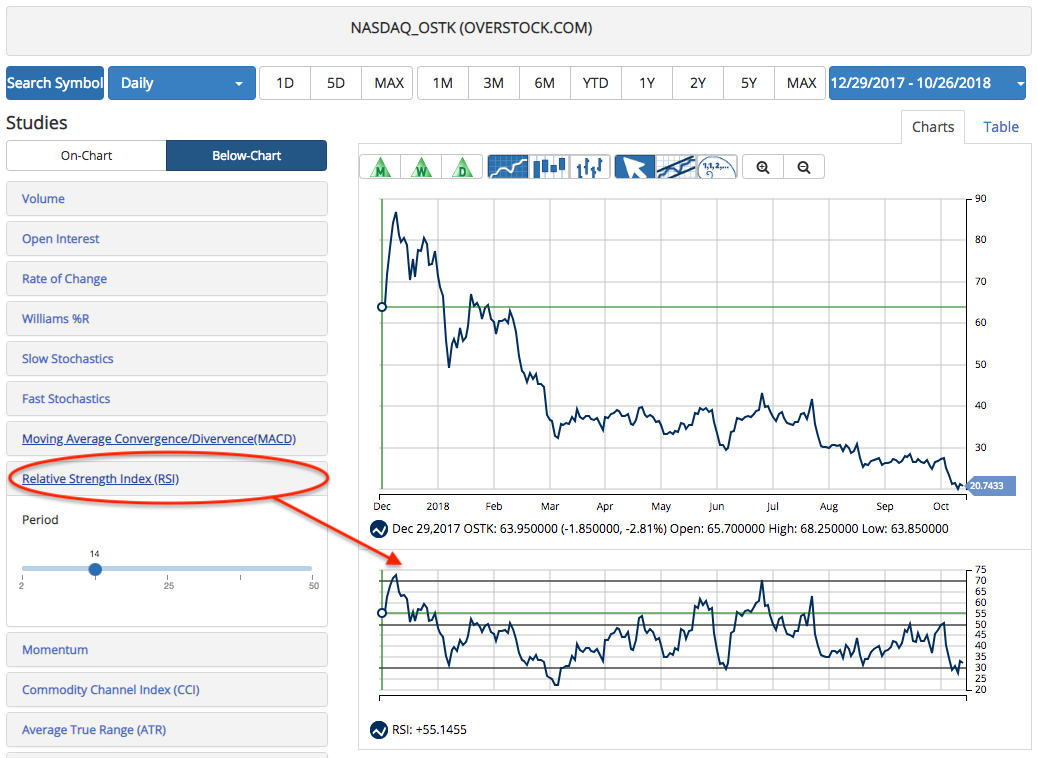
The RSI indicator is shown on a scale of 0 to 100, with levels marked at 70 and 30, and a mid-line at 50. Wilder recommended a calculation based on a 14 day period, but this can be adjusted to change the sensitivity of the indicator.
Identifying Overbought and Oversold Areas
Using the default 14-day RSI, traders can consider the market overbought when the indicator moves over 70 and oversold when the indicator moves below 30. The RSI typically works better in sideways moving markets when determining these areas.
Support and Resistance Levels With the RSI
The RSI indicator can also be used as an additional tool to help traders find support and resistance levels. The mid-line at 50 on the RSI can sometimes be viewed as both the support and resistance line for the indicator. In a downtrend, the RSI can provide resistance at 50, and in an uptrend, the RSI can provide support at 50.
Spotting Reversals With Divergences
Traders can also use the RSI to spot divergences between the indicator and price action. Wilder believed that divergences indicated a potential reversal point. A bullish divergence can be seen when the price action of a security makes a lower low, while the RSI indicator makes a higher low. This could indicate the market might reverse and move higher. A bearish divergence can be seen when the price action of a security makes a higher high, while the RSI indicator makes a lower high. This could indicate the market might reverse and move lower.
MarketClub members can find this study in the Below-Chart list in your customizable charts. Join MarketClub to test our charts and practice using the RSI.