Updated as of July 23, 2020
The strongest stocks under $10 can be attractive additions to your watch list. Not only can traders and investors typically take a larger position in a particular company, but these stocks often fly under the radar of institutional traders.
Once the big boys take notice, the share price could soar taking you along with it.
With MarketClub’s Smart Scan Technology, members can quickly create lists of the strongest-trending stocks, futures, forex, ETFs, and mutual funds that fall into a desired share price range.
Here are 10 strong stocks under $10…
Ford Motor Company (F)
Ford is one of the most iconic U.S. automakers. This Michigan-based company designs, manufactures, markets, and services cars, trucks, and sport utility vehicles worldwide.
The company has missed the last two earnings estimates and reported a fall in revenue compared to the last quarter of 2019. Ford is scheduled to announce Q2 2020 earnings on July 30, 2020.
Ford has been making headlines with its comeback of the Ford Bronco, a model with a cult following. On the night of the reveal, Ford presold all units that were set to come off the production line. The company decided to double production to meet consumers’ excitement. Eager followers called dibs on those added 3,500 Broncos as well.
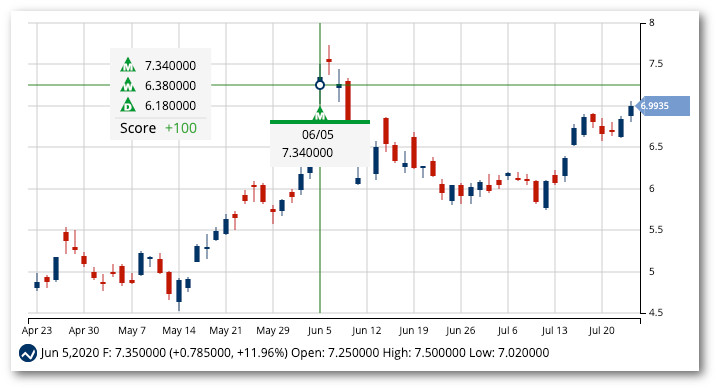
A strong move up the chart triggered a green, monthly Trade Triangle on June 5, 2020. While the stock has experienced a pullback, the technicals are strong.
Avg. Volume: 83,606,688
Market Cap: 27.8B
Last Monthly Green Trade Triangle: 6/5/20 @ $7.34
Unrealized Gain/Loss Since Triangle: -$0.33 (-4.5%)
Smart Scan Score: +100
CymaBay Therapeutics, Inc. (CBAY)
CymaBay Therapeutics, Inc. is a biopharma company that develops and provides therapies to treat liver and other chronic diseases. The company was incorporated in the late 80s in California.
The stock received a number of upgrades in May of 2020, with Stifel, B. Riley FBR, and HC Wainwright & Co. all rating CBAY as a “buy”.
On July 23, 2020, volume exploded more than 70x the average volume from the day before.
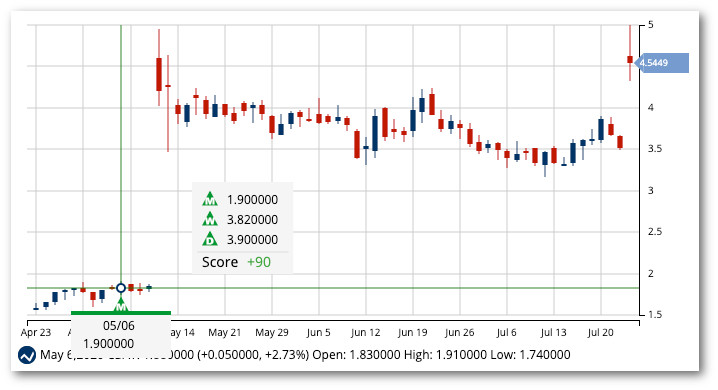
Despite the odd trading activity, MarketClub detected a change in the long-term trend in early May. Members received a green Trade Triangle when the share price hit $1.90.
Avg. Volume: 1,450,339
Market Cap: 302M
Last Monthly Green Trade Triangle: 5/6/20@ $1.90
Unrealized Gain/Loss Since Triangle: $2.49 (131.05%)
Smart Scan Score: +90
OPKO Health, Inc. (OPK)
OPKO is a diagnostics and pharmaceutical company based in Miami, Flordia. The diagnostic segment operates a clinical testing lab. The pharmaceutical arm offers treatments for hyperparathyroidism, kidney disease, diabetes, and other medical conditions.
The company has a big earnings beat in Q4 of 2019, while it met expectations for Q1 of 2020. The company is set to announce earnings on August 5, 2020.
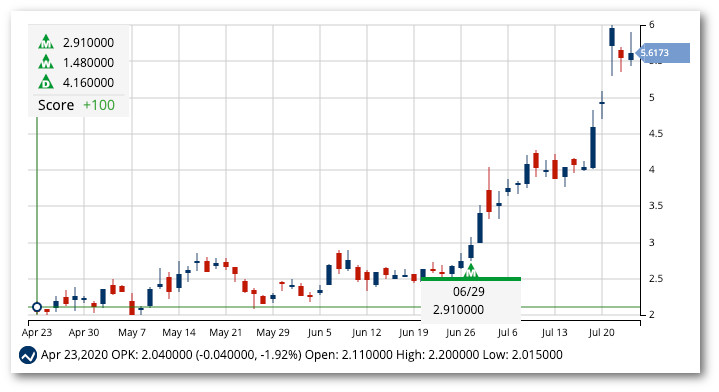
While the company is struggling to break the profitability barrier, the technicals look good. A change in the long-term trend was detected in late June before stock rocketed up past the $5/share level.
Avg. Volume: 19,177,155
Market Cap: 3.8B
Last Monthly Green Trade Triangle: 6/29/20 @ $2.91
Unrealized Gain/Loss Since Triangle: $2.69 (92.44%)
Smart Scan Score: +100
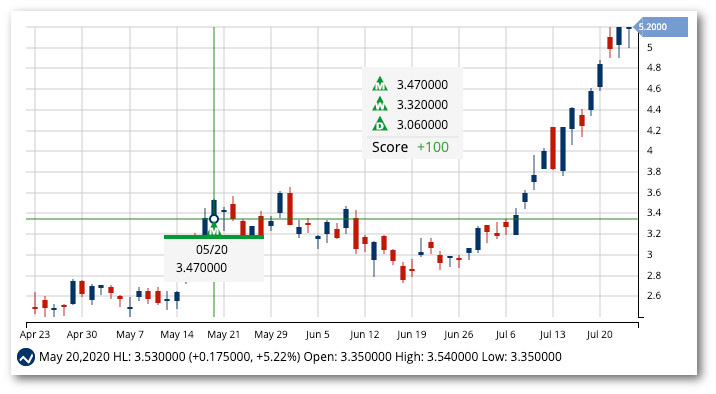
Hecla Mining Co. (HL)
This company, together with its subsidiaries, discovers, acquires, develops precious and base metal properties in the U.S. and around the world.
HL made a 3-month low on March 18, 2020, and moved sideways until gaining momentum towards the middle of May.
MarketClub triggered a long-term Trade Triangle May 20, 2020, and the stock has since rocked up over the $5/share mark.
Avg. Volume: 11,410,775
Market Cap: 2.7B
Last Monthly Green Trade Triangle: 5/20/20 @ $3.41
Unrealized Gain/Loss Since Triangle: $1.72 (50.4%)
Smart Scan Score: +90
Sirius XM Holdings, Inc. (SIRI)
Sirius is one of the top satellite radio companies operating in the U.S. Covering a wide array of topics and music genres, the company offers services to customers on a subscription basis. The company also distributes satellite-equipped radios to automakers.
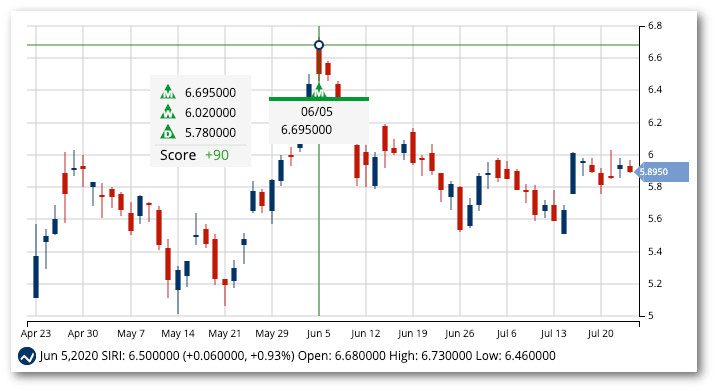
The current analyst price target is sitting at $6.51, about 20% over the current market price. The company blew Q1 2020 earnings estimates out of the water and will announce Q2 2020 earnings on July 30, 2020.
The bullish momentum was strong through the spring of 2020 before the stock fell below the $6 level. Despite the short-term weakness, the Smart Scan Score of +90 and the technicals point to a move higher.
Avg. Volume: 26,842,302
Market Cap: 25.8B
Last Monthly Green Trade Triangle: 6/5/20 @ $6.69
Unrealized Gain/Loss Since Triangle: -$0.80 (-11.96%)
Smart Scan Score: +90
Harmony Gold Mining Co. (HMY)
Gold is the name of the game for Harmony. While the company focuses on the exploration, extraction, and processing of gold in South Africa, Harmony also explores for uranium, silver, and copper.
The 10-day average volume is at 11.98M, exceeding the 3-month average volume of 7.95M.
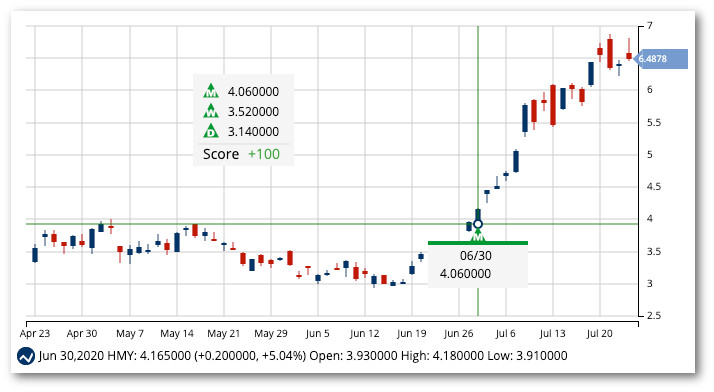
The long-term Trade Triangle caught the move for HMY before it exploded to all-time highs.
Avg. Volume: 9,232,798
Market Cap: 3.9B
Last Monthly Green Trade Triangle: 6/30/20 @ $4.06
Unrealized Gain/Loss Since Triangle: $2.41 (59.36%)
Smart Scan Score: +100
CleanSpark, Inc. (CLSK)
CleanSpark provides energy software and control technology to allows customers to manage their own energy storage and distribution. The company also offers consulting services and builds hardware solutions for military, commercial, and residential properties.
The company was awarded a $2.9M grant from the California Energy Commission to help repurpose batteries from electric vehicles (EV) which can retain 70-90% of their original capacity.
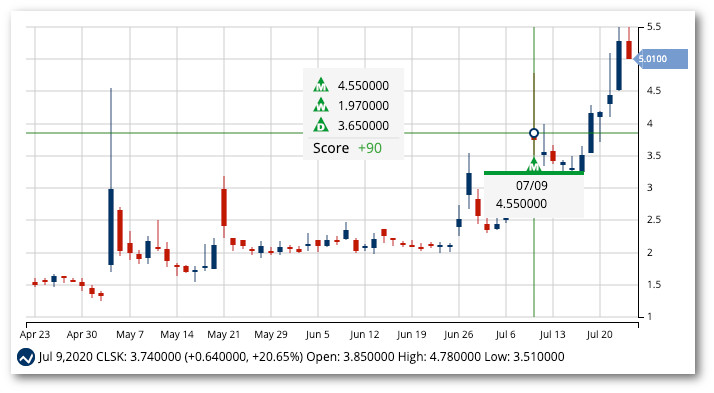
After months of sideways price action, the stock started to gain momentum in early July and triggered a new, monthly Trade Triangle.
Avg. Volume: 6,338,234
Market Cap: 48M
Last Monthly Green Trade Triangle: 7/9/20 @ $4.55
Unrealized Gain/Loss Since Triangle: $0.32 (7.03%)
Smart Scan Score: +90
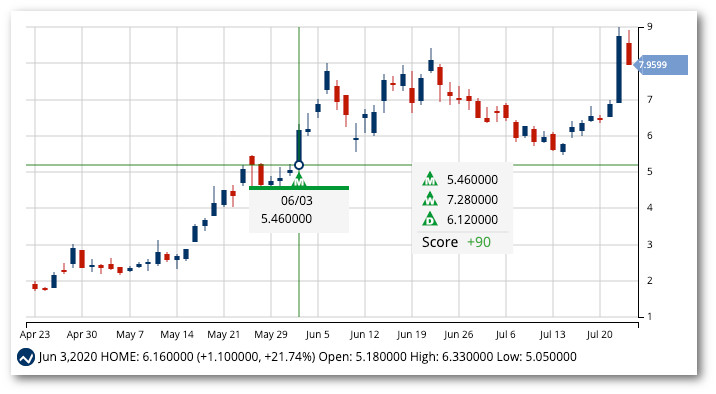
At Home Group, Inc. (HOME)
At Home Group is a growing home decor superstore in the United States that is giving Home Goods a run for its money. As of June 2020, there are more than 200 stores in 40 U.S. states.
After coming in 42% under Q2 2020 earnings estimates, HOME is back at the plate and set to announce earnings after the market close on July 29, 2020.
Avg. Volume: 3,418,056
Market Cap: 530M
Last Monthly Green Trade Triangle: 6/3/20 @ $5.46
Unrealized Gain/Loss Since Triangle: $2.81 (51.47%)
Smart Scan Score: +90
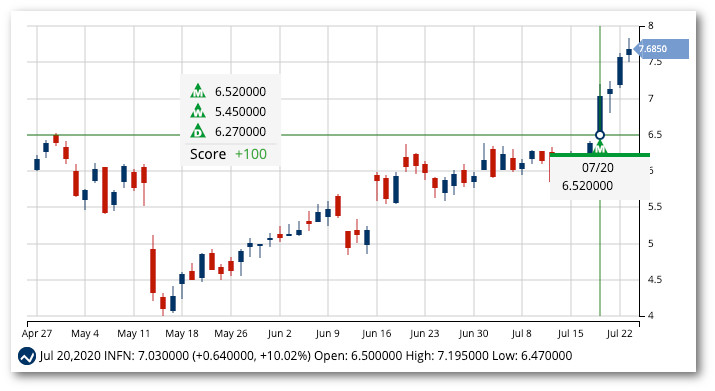
Infinera Corp. (INFN)
Infinera Corporation provides optical transport equipment, software, and services to clients all over the globe. The company is headquartered in California and employs over 3,000 people.
The company has strong relationships with some of the most powerful communications companies. As these com-giants race to meet the growing bandwidth demands of consumers, INFN is a position to offer up their services in a big way.
Infinera will release Q2 2020 financial results after the markets close on August 5, 2020.
Avg. Volume: 3,334,840
Market Cap: 1.5B
Last Monthly Green Trade Triangle: 7/20/20 @ $6.52
Unrealized Gain/Loss Since Triangle: $1.28 (19.6%)
Smart Scan Score: +100
MobileIron, Inc. (MOBL)
This company provides a mobile IT platform that gives employees more device choices with regard to their mobile equipment while preserving security and privacy. MobileIron services clients in government, financial services, healthcare, legal, and other sectors.
The company beat earnings expectations in Q1 2020 and is scheduled to announce earnings once again on July 29, 2020.
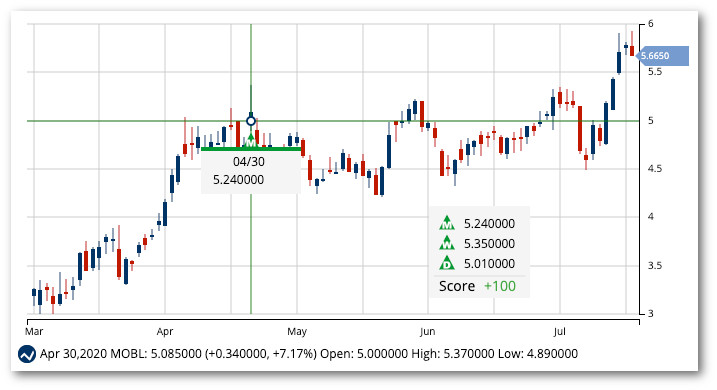
MOBL’s stock took a sharp drop in mid-March. As the stock corrected, a long-term bullish trend triggered a new Trade Triangle for MarketClub members on April 30, 2020, at $5.24.
Avg. Volume: 933,295
Market Cap: 651M
Last Monthly Green Trade Triangle: 4/30/20 @ $5.24
Unrealized Gain/Loss Since Triangle: $0.41 (7.82%)
Smart Scan Score: +100
*Data for this post was collected as of the close on 7/23/20.
The market is always moving, creating opportunities at every moment. Members of MarketClub have access to these powerful scans and can create lists like this as the market swings.
Join MarketClub right now and start creating your own custom scan of the strongest stocks under $10.
