Oh, the internet is buzzing – it’s Amazon Prime Day!
This annual subscriber-only sales celebration offers heavy discounts on everything from ink pens to blenders and everything in between. In 2018, Amazon sold over 100 million products on Prime Day and experts are predicting that this year will blow past last year’s numbers.
Marketing technology and services firm, Ignition One, projects that Amazon will generate $6.61B in sales, exceeding last year’s total by $2B.
What will this mean for Amazon’s stock movement?
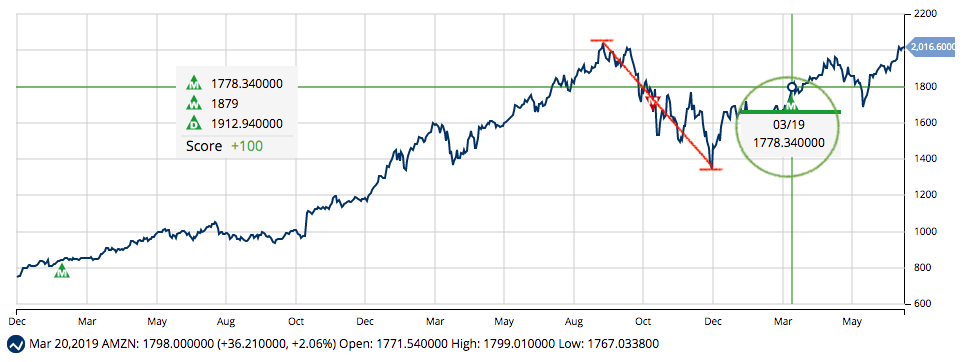
After hitting an all-time high on 9/4/18 at $2,050.50, AMZN fell 36% over the next four months. On 12/24/18, the stock hit a low on 12/24/18 at $1,307 – the stock has been climbing ever since.

MarketClub detected a strong reversal on 3/19/19 at $1,778.34 and issued a monthly Trade Triangle.
MarketClub members following this signal would be sitting on a $238.26/share (13.3%) gain and would remain in a long position until a red monthly Trade Triangle signals an exit.

Right now our MarketClub analysis shows a score of +100. This strong rating suggests that AMZN is in the confines of a stable, long-term trend.
While this year’s Amazon Prime Day is expected to be another huge hit, it looks like Amazon’s stock has the technical backing to also knock it out of the park.
Begin your 30-day MarketClub trial to get the next signal for AMZN and the daily trend rating.
You’ll also get our full analysis on Amazon (AMZN) and over 350K other stocks, ETFs, futures, forex, or mutual fund markets.
Have a question? Contact our support team!
